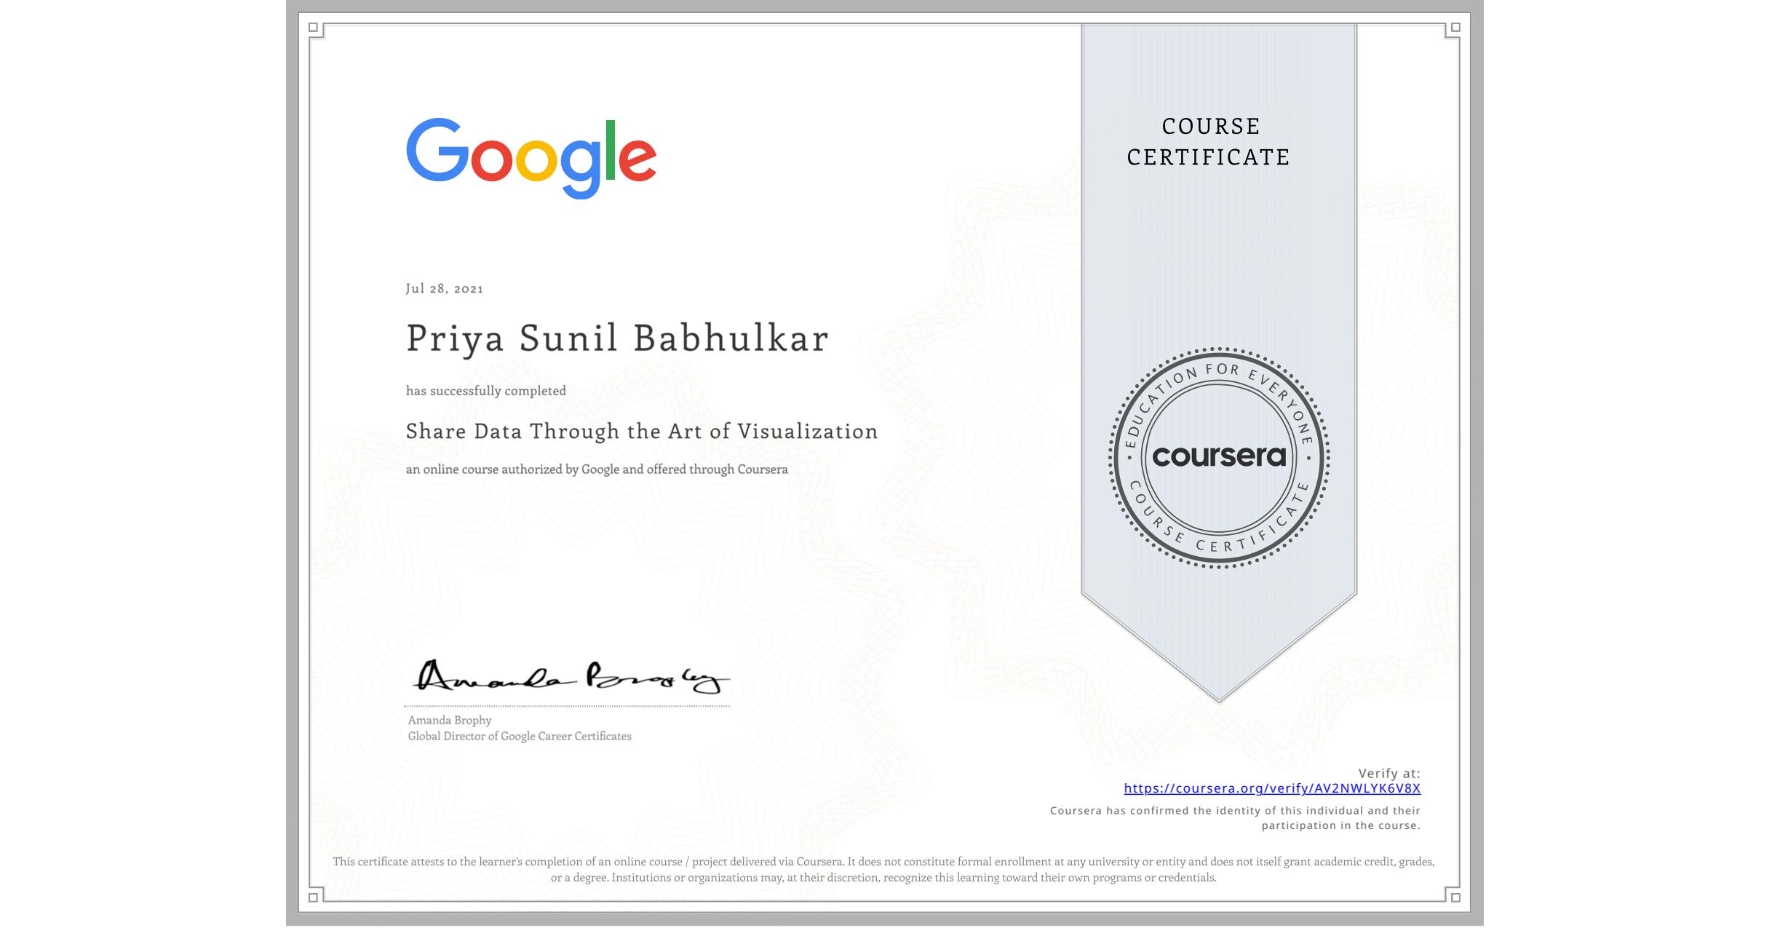
Share Data Through the Art of Visualization
Completed by Priya Sunil Babhulkar
July 28, 2021
18 hours (approximately)
Priya Sunil Babhulkar's account is verified. Coursera certifies their successful completion of Share Data Through the Art of Visualization

What you will learn
Describe the use of data visualizations to talk about data and the results of data analysis.
Identify Tableau as a data visualization tool and understand its uses.
Explain what data driven stories are including reference to their importance and their attributes.
Explain principles and practices associated with effective presentations.
Skills you will gain
- Category: Data Presentation
- Category: Dashboard
- Category: Tableau Software
- Category: Data Visualization
- Category: Data Storytelling
- Category: Presentations
- Category: Data Analysis
- Category: Data Visualization Software
- Category: Dashboard Creation