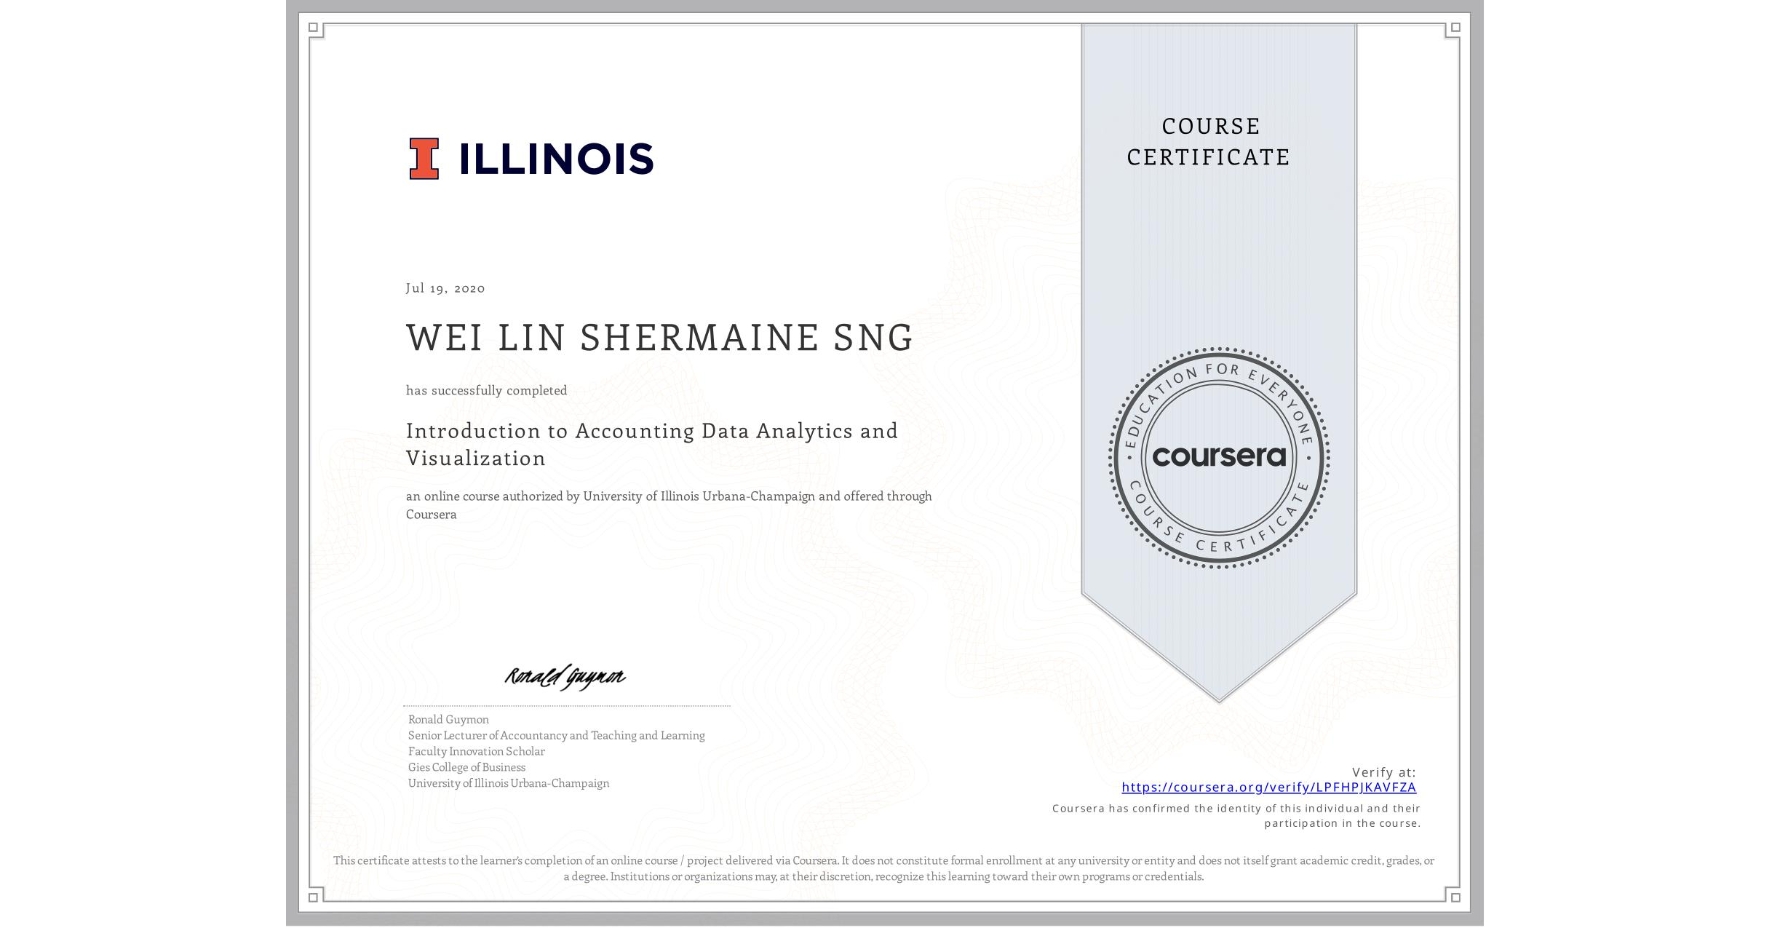
Introduction to Accounting Data Analytics and Visualization
Completed by WEI LIN SHERMAINE SNG
July 19, 2020
20 hours (approximately)
WEI LIN SHERMAINE SNG's account is verified. Coursera certifies their successful completion of Introduction to Accounting Data Analytics and Visualization

What you will learn
Articulate the benefits of using Big Data and analytics in the modern accounting profession.
Describe and implement a framework for using Big data to help provide insights that lead to action.
Critique the ability of a dataset to answer questions, then assemble data from different sources for summarization, visualization, and analysis.
Use Excel, Tableau, and Visual Basic for Applications to design and perform basic and advanced analyses.
Skills you will gain
- Category: Accounting Software
- Category: Data Visualization Software
- Category: Data Presentation
- Category: Predictive Analytics
- Category: Data Compilation
- Category: Tableau Software
- Category: Analytical Skills
- Category: Microsoft Excel
- Category: Interactive Data Visualization
- Category: Analytics
- Category: Spreadsheet Software
- Category: Data Architecture