Filter by
The language used throughout the course, in both instruction and assessments.
Results for "visualizations"

Skills you'll gain: Data Analysis

Fractal Analytics
Skills you'll gain: Data Visualization, Storytelling
 Status: Free
Coursera Project Network
Skills you'll gain: Data Visualization, Web Design, Web Development

Coursera Project Network
Skills you'll gain: Data Analysis, Data Science, Data Visualization, Interactive Data Visualization, Python Programming
 Status: Free
Coursera Instructor Network

Coursera Project Network

University of Washington
Skills you'll gain: Machine Learning, Machine Learning Algorithms, Algorithms, Human Learning, Applied Machine Learning, Probability & Statistics, Statistical Machine Learning, Decision Making, Python Programming, Probability Distribution

University of Maryland, College Park

University of Maryland, College Park

University of Maryland, College Park

Corporate Finance Institute

Corporate Finance Institute
Searches related to visualizations
In summary, here are 10 of our most popular visualizations courses
- CASL Programming for Distributed Computing in SAS® Viya®: SAS
- Data Storytelling: Fractal Analytics
- Responsive Design in Bootstrap: Create an Admin Dashboard: Coursera Project Network
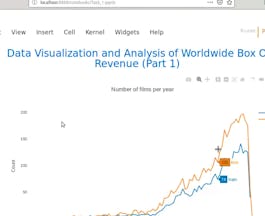
- Analyze Box Office Data with Seaborn and Python: Coursera Project Network
- Creating Infographics with GenAI for Marketing: Coursera Instructor Network
- Visualizing and Collaborating with Popplet: Coursera Project Network
- Machine Learning: Classification: University of Washington
- Storytelling and Persuading with Data and Digital Technology: University of Maryland, College Park
- Digital Transformation with Data Analytics Projects: University of Maryland, College Park
- Transforming with Data Analytics and Organization: University of Maryland, College Park


