Results for "igraph"
 Status: Free Trial
University of Colorado Boulder
Skills you'll gain: Dashboard, Data Visualization Software, Tableau Software, Data Visualization, Interactive Data Visualization, Data Storytelling, Data Presentation, Data Analysis, Geospatial Mapping, Histogram, Advanced Analytics, Spatial Analysis, Scatter Plots, Data Science, Data Manipulation, Data Import/Export, Business Analytics, Marketing Analytics, Analytics, Forecasting
 Status: Preview
Michigan State University
Skills you'll gain: Infographics, Adobe Illustrator, Graphic and Visual Design, Data Mapping, Graphic Design, Typography, Layout Design, Design Elements And Principles, Storytelling, Color Theory
 Status: Free Trial
University of California San Diego
Skills you'll gain: Graph Theory, Algorithms, Network Routing, Programming Principles, Social Network Analysis, Data Structures, Network Analysis, Network Model
 Status: NewStatus: Free Trial
Skills you'll gain: LangGraph, Generative AI Agents, AI Orchestration, Agentic systems, AI Workflows, OpenAI API, LLM Application, Agentic Workflows, Prompt Patterns, OpenAI, Large Language Modeling, AI Enablement, Retrieval-Augmented Generation, Artificial Intelligence, Development Environment, Tool Calling, Microsoft Azure, AI Personalization, Microsoft Development Tools, Microsoft Visual Studio
 Status: Free Trial
Skills you'll gain: Data Storytelling, Data Presentation, Plotly, Data Visualization Software, Data Visualization, Dashboard, Interactive Data Visualization, Matplotlib, Geospatial Information and Technology, Histogram, Seaborn, Data Analysis, Scatter Plots, Jupyter, Geospatial Mapping, Python Programming
 Status: Preview
University of Illinois Urbana-Champaign
Skills you'll gain: Data Visualization, Interactive Data Visualization, Data Presentation, Infographics, Data Visualization Software, Data Storytelling, Plotly, Matplotlib, Journalism, Graphing, Data Literacy, Color Theory, Data Manipulation, Design Elements And Principles, Data Analysis
 Status: New
Skills you'll gain: Graph Theory, Network Analysis, Social Network Analysis, NoSQL, Data Science, Query Languages, Visualization (Computer Graphics), Applied Machine Learning, Data Transformation, Big Data, Python Programming, Spatial Data Analysis, Advanced Analytics, Deep Learning, Machine Learning, Machine Learning Algorithms, Time Series Analysis and Forecasting, Simulations
 Status: NewStatus: Free Trial
Skills you'll gain: Data Storytelling, Data Presentation, Data Visualization, Data Visualization Software, Scatter Plots, Technical Communication, Histogram
 Status: Free Trial
Skills you'll gain: AI Orchestration, AI Workflows, Agentic Workflows, Agentic systems, Generative AI Agents, LLM Application, Application Design, Tool Calling, Large Language Modeling, Context Management, Software Design Patterns
 Status: Preview
California Institute of the Arts
Skills you'll gain: Typography, Infographics, Graphic and Visual Design, Computer Graphics, Visualization (Computer Graphics), Design, Graphic Design, Design Elements And Principles, Color Theory, Image Analysis, Adobe Creative Cloud, Creativity
 Status: Free Trial
Skills you'll gain: Ggplot2, Data Visualization Software, Data Visualization, Statistical Visualization, Rmarkdown, Shiny (R Package), Dashboard, Leaflet (Software), Interactive Data Visualization, R Programming, Scatter Plots, Box Plots, Spatial Data Analysis, Histogram, Data Science, Data Analysis, User Interface (UI), UI Components
 Status: Free Trial
Skills you'll gain: Retrieval-Augmented Generation, Vector Databases, AI Workflows, Embeddings, Large Language Modeling, Graph Theory, Query Languages, Data Visualization Software, Development Environment
In summary, here are 10 of our most popular igraph courses
- Data Visualization & Analytics in Tableau: University of Colorado Boulder
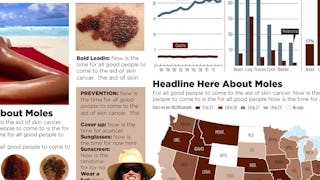
- Design and Make Infographics (Project-Centered Course): Michigan State University
- Algorithms on Graphs: University of California San Diego
- AI Agents with LangGraph, Semantic Kernel, and AutoGen: Packt
- Data Visualization with Python: IBM
- Visualization for Data Journalism: University of Illinois Urbana-Champaign
- Modern Graph Theory Algorithms with Python: Packt
- Charts: Visualize Data Like a Pro: Coursera
- Agentic AI with LangGraph, CrewAI, AutoGen and BeeAI: IBM
- Fondamentaux de l’infographie: California Institute of the Arts


