Filter by
The language used throughout the course, in both instruction and assessments.
Results for "graphs"


Johns Hopkins University
Skills you'll gain: Algebra, Arithmetic, Mathematical Modeling, Graphing, Probability & Statistics, Calculus

University of Michigan
Skills you'll gain: Sampling (Statistics), Data Visualization, Statistics, Matplotlib, Statistical Visualization, Probability & Statistics, Jupyter, Statistical Methods, Data Visualization Software, Data Analysis, Statistical Analysis, Exploratory Data Analysis, Descriptive Statistics, Statistical Inference, Data Collection, NumPy, Box Plots, Histogram, Python Programming

University of Michigan
Skills you'll gain: Network Analysis, Network Model, Graph Theory, Data Analysis, Predictive Analytics, Exploratory Data Analysis, Applied Machine Learning, Unsupervised Learning

Coursera Project Network
Skills you'll gain: Data Presentation, Data Synthesis, Data Storytelling, Data Visualization Software, Google Sheets, Graphing
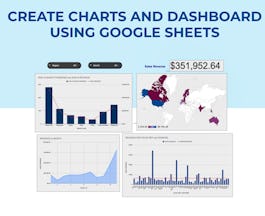

Coursera Project Network
Skills you'll gain: Dashboard, Google Sheets, Spreadsheet Software, Pivot Tables And Charts, Data Visualization, Data Visualization Software, Data Presentation, Interactive Data Visualization, Excel Formulas, Data Cleansing, Data Manipulation

Coursera Project Network
Skills you'll gain: Plotly, Interactive Data Visualization, Data Visualization Software, Scatter Plots, Ggplot2, Exploratory Data Analysis
 Status: Free
Coursera Project Network
Skills you'll gain: Dashboard, Interactive Data Visualization, Data Presentation, Tableau Software, Data Visualization Software, Data Storytelling
 Status: Free
Princeton University
Skills you'll gain: Graph Theory, Data Structures, Algorithms, Theoretical Computer Science, Operations Research, Applied Mathematics, Computational Thinking, Computer Programming, Network Routing, Programming Principles, Network Model, Java Programming, Linear Algebra


Coursera Project Network
Skills you'll gain: Spreadsheet Software, User Accounts


Coursera Project Network
Skills you'll gain: Plotly, Datamaps, Interactive Data Visualization, Data Visualization Software, Scatter Plots, Jupyter, Epidemiology, Python Programming, Exploratory Data Analysis, Data Analysis, Medical Science and Research

Skills you'll gain: Dashboard, Data Storytelling, Data Visualization Software, Microsoft Excel, Spreadsheet Software, Graphing, Pivot Tables And Charts, Data Modeling, Databases, Data Analysis, Simulation and Simulation Software


Google Cloud
Skills you'll gain: Data Pipelines, Extract, Transform, Load, Google Cloud Platform, Data Integration, Data Processing, Apache Hadoop, Apache Spark, Big Data, Data Transformation, Cloud Computing, Cloud Services
In summary, here are 10 of our most popular graphs courses
- Algebra: Elementary to Advanced - Equations & Inequalities: Johns Hopkins University
- Understanding and Visualizing Data with Python: University of Michigan
- Applied Social Network Analysis in Python: University of Michigan
- Overview of Data Visualization: Coursera Project Network
- Create Charts and Dashboard using Google Sheets: Coursera Project Network
- Data Visualization with Plotly Express: Coursera Project Network
- Tableau Public for Beginners: Data Visualization Basics: Coursera Project Network
- Algorithms, Part II: Princeton University
- Charts, Pictures, Themes, and Styles in Microsoft Excel: Coursera Project Network
- Covid-19 Death Medical Analysis & Visualization using Plotly: Coursera Project Network


