Results for "chart.js"

Skills you'll gain: Presentations, Sales Presentations, Sales Presentation, Data Visualization, Productivity Software, Design
 Status: Free Trial
University of Pittsburgh
Skills you'll gain: Data Storytelling, Data Presentation, Interactive Data Visualization, Data Visualization Software, Data Visualization, Network Analysis, Tableau Software, Statistical Visualization, Network Model, Dashboard, Time Series Analysis and Forecasting, Matplotlib, Data Analysis, Seaborn, Graph Theory, Pandas (Python Package), Python Programming
 Status: Free
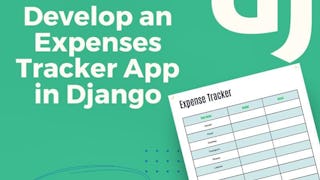
Skills you'll gain: Django (Web Framework), Web Applications, Back-End Web Development, Expense Management, Application Development, Database Application, Data Visualization, Business Process Automation, Chart.js, Python Programming, Data Modeling, Data Security, GitHub, Javascript, Git (Version Control System)
 Status: Preview
Ball State University
Skills you'll gain: Data Visualization, Rmarkdown, Exploratory Data Analysis, Data Visualization Software, Ggplot2, Interactive Data Visualization, Plot (Graphics), Statistical Visualization, R (Software), R Programming, Data Storytelling, Histogram, Scatter Plots, Data Analysis, Tidyverse (R Package), Data Manipulation

Skills you'll gain: Marketing Design, Organizational Structure, Diagram Design, Marketing Collateral, Graphic Design, Presentations

Skills you'll gain: Timelines, Project Schedules, Scheduling, Project Management, Project Management Software, Project Planning, Project Documentation, Dependency Analysis
 Status: Free Trial
Johns Hopkins University
Skills you'll gain: Ggplot2, Data Visualization Software, Data Visualization, Datamaps, Visualization (Computer Graphics), Interactive Data Visualization, Scatter Plots, Histogram, Graphic and Visual Design, R Programming, Geospatial Information and Technology, Geospatial Mapping
 Status: Free Trial
Skills you'll gain: Matplotlib, Data Storytelling, Data Presentation, Data Visualization, Plot (Graphics), Scientific Visualization, Data Visualization Software, Scatter Plots, Image Quality, NumPy, Histogram, Image Analysis
 Status: Free Trial
Johns Hopkins University
Skills you'll gain: Rmarkdown, Tidyverse (R Package), Ggplot2, Spatial Data Analysis, Data Visualization Software, Statistical Visualization, Geospatial Information and Technology, Data Manipulation, Scatter Plots, Plotly, Interactive Data Visualization, R Programming, Data Mapping, Animations

Skills you'll gain: Data Storytelling, Infographics, Interactive Data Visualization, Data Visualization, Storytelling, Storyboarding, Diagram Design, Data Analysis, Graphic and Visual Design

Skills you'll gain: Matplotlib, Seaborn, Plot (Graphics), Scatter Plots, Histogram, Data Visualization, Data Visualization Software, Statistical Visualization, Data Analysis, Python Programming

Google Cloud
Skills you'll gain: Kubernetes, Application Performance Management, YAML, Google Cloud Platform, Configuration Management, Real Time Data, Data Analysis
In summary, here are 10 of our most popular chart.js courses
- Presenting Data Using Charts with Canva: Coursera
- Tableau, Networks & Time Series Data Visualization: University of Pittsburgh
- Build an expense tracker app in Django: Coursera
- Data Visualization: Ball State University
- Create an Organizational Company Chart with Canva: Coursera
- Create a Gantt Chart with Lucidchart: Coursera
- Building Data Visualization Tools: Johns Hopkins University
- Mastering Data Visualization with Matplotlib: EDUCBA
- Advanced Data Visualization with R: Johns Hopkins University
- Create an infographic with Infogram : Coursera


