Filter by
The language used throughout the course, in both instruction and assessments.
Results for "motion+chart"


Microsoft
Skills you'll gain: Data Storytelling, Data Presentation, Power BI, Data Visualization Software, Data Visualization, Interactive Data Visualization, Dashboard, Business Intelligence, Data Analysis, Scatter Plots


Coursera Project Network
Skills you'll gain: Plotly, Exploratory Data Analysis, Scatter Plots, Plot (Graphics), Data Visualization Software, Statistical Visualization, Interactive Data Visualization

Coursera Project Network
Skills you'll gain: Matplotlib, Seaborn, Plot (Graphics), Scatter Plots, Histogram, Data Visualization, Data Visualization Software, Statistical Visualization


Coursera Project Network
Skills you'll gain: Presentations, Sales Presentations, Data Visualization, Marketing Collateral

Coursera Project Network
Skills you'll gain: Marketing Design, Organizational Structure, Marketing Collateral, Presentations, Dashboard, Data Visualization, Data Sharing
 Status: Free
Exploratorium
Skills you'll gain: Collaboration, Creative Thinking, Creativity, Curiosity, Design Thinking, Mechanics, Research and Design, Research, Creative Problem-Solving, Experimentation, Engineering Design Process, Liberal Arts, Mechanical Design, Storytelling, Aesthetics, Engineering


Macquarie University
Skills you'll gain: Pivot Tables And Charts, Data Storytelling, Data Presentation, Data Visualization Software, Data Visualization, Interactive Data Visualization, Spreadsheet Software, Dashboard, Microsoft Excel, Excel Macros, Infographics, Excel Formulas, Data Analysis, Data Manipulation, Forecasting

University of Colorado Boulder
Skills you'll gain: Numerical Analysis, Simulations, Engineering Analysis, Visualization (Computer Graphics), Engineering Calculations, 3D Modeling, Mathematical Modeling, Applied Mathematics

University of Colorado Boulder
Skills you'll gain: Data Visualization Software, Interactive Data Visualization, Visualization (Computer Graphics), User Centered Design, Data Presentation, Usability, Data Storytelling, Human Computer Interaction, Design Research, Usability Testing, Requirements Analysis


Coursera Project Network
Skills you'll gain: Matplotlib, Histogram, Plot (Graphics), Data Visualization, Seaborn, Scatter Plots, Data Visualization Software, Statistical Visualization, Exploratory Data Analysis


University of Michigan
Skills you'll gain: Kinesiology, Stress Management, Respiration, Self-Awareness, Mental Concentration, Activities of Daily Living (ADLs), Anatomy, Injury Prevention
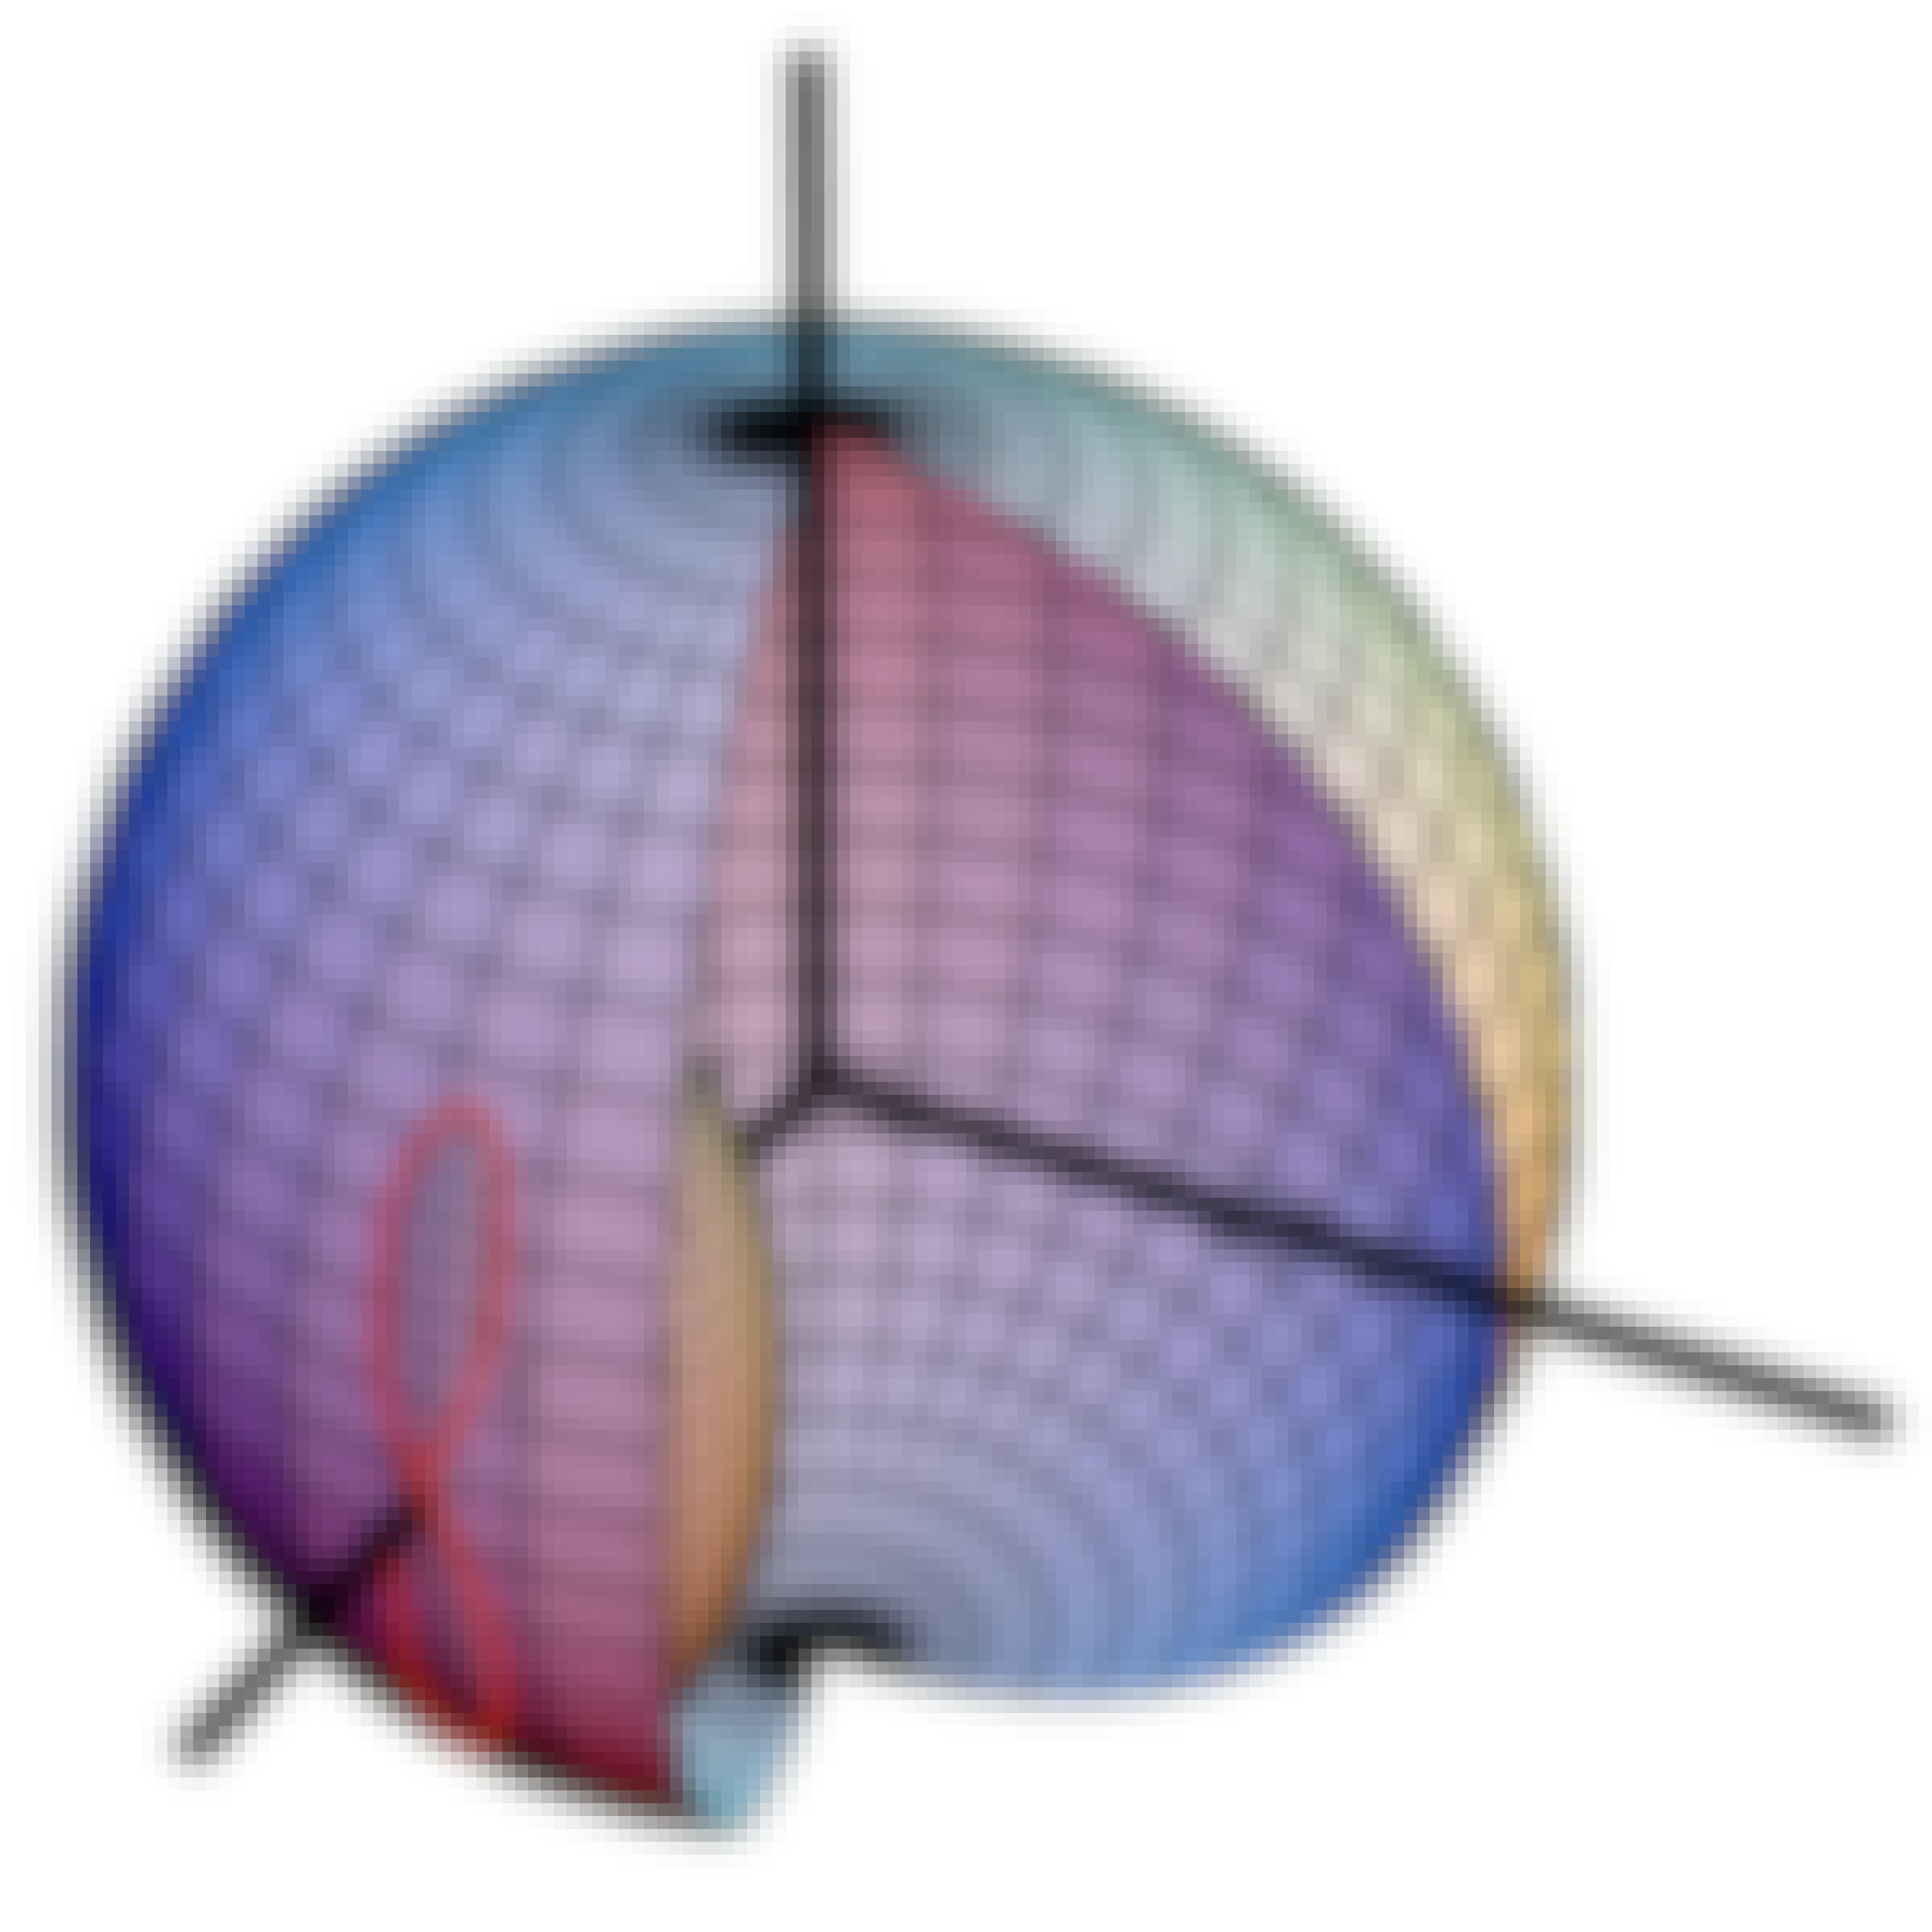

University of Colorado Boulder
Skills you'll gain: Torque (Physics), Mathematical Modeling, Linear Algebra, Differential Equations, Simulation and Simulation Software, Applied Mathematics, Engineering Analysis, Mechanics, Advanced Mathematics
In summary, here are 10 of our most popular motion+chart courses
- Data Visualization Fundamentals: Microsoft
- Data Visualization using Plotly: Coursera Project Network
- Python for Data Visualization:Matplotlib & Seaborn(Enhanced): Coursera Project Network
- Presenting Data Using Charts with Canva: Coursera Project Network
- Create an Organizational Company Chart with Canva: Coursera Project Network
- Tinkering Fundamentals: Motion and Mechanisms: Exploratorium
- Data Visualization in Excel: Macquarie University
- Spacecraft Dynamics Capstone: Mars Mission: University of Colorado Boulder
- Fundamentals of Data Visualization: University of Colorado Boulder
- Python for Data Visualization: Matplotlib & Seaborn: Coursera Project Network


