Filter by
The language used throughout the course, in both instruction and assessments.
Results for "scalable+vector+graphics+(svg)"

Coursera Project Network
Skills you'll gain: Data Visualization, Python Programming
 Status: Free
Google Cloud
 Status: Free
Coursera Instructor Network
Skills you'll gain: Generative AI, Data Storytelling, Data Visualization, Data Visualization Software, Interactive Data Visualization, Data Presentation, Data Wrangling, Data-Driven Decision-Making, Real Time Data, Dashboard, Technical Communication, Artificial Intelligence
Coursera Project Network
Skills you'll gain: Data Analysis, Data Visualization, Javascript
 Status: Free
DeepLearning.AI
Skills you'll gain: Generative AI

Skills you'll gain: Cloud Computing

Skills you'll gain: Data Visualization, Storytelling

Google Cloud

Duke University
Skills you'll gain: Data Visualization Software, Data Visualization, Data Storytelling, Interactive Data Visualization, Plotly, Matplotlib, Dashboard, Seaborn, Tableau Software, Scatter Plots, Spreadsheet Software, Histogram, Google Sheets, Microsoft Excel, Business Intelligence Software, Pandas (Python Package)
 Status: Free
Coursera Instructor Network
Skills you'll gain: Application Development
In summary, here are 10 of our most popular scalable+vector+graphics+(svg) courses
- Data Visualization using Plotnine and ggplot: Coursera Project Network
- Introduction to Image Generation - Italiano: Google Cloud
- Generative AI for Data Visualization and Data Storytelling: Coursera Instructor Network
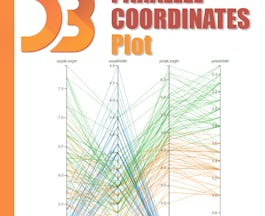
- Simple Parallel Coordinates Plot using d3 js: Coursera Project Network
- Building Applications with Vector Databases: DeepLearning.AI
- Getting Started with Vector Search and Embeddings: Google Cloud
- Data Visualization and Reporting with Generative AI: Microsoft
- Vector Search and Embeddings - 한국어: Google Cloud
- Data Visualization with Python: Duke University
- GenAI for Application Developers: Coursera Instructor Network
