Results for "chart"

Skills you'll gain: Kubernetes, YAML, Application Deployment, CI/CD, Docker (Software), Containerization, Devops Tools, Package and Software Management, Cloud Deployment, Development Environment, Release Management, Command-Line Interface, Configuration Management, Go (Programming Language), Software Versioning, File Management
 Status: Free Trial
Skills you'll gain: Data Storytelling, Data Visualization, Matplotlib, Plotly, Scientific Visualization, Seaborn, Exploratory Data Analysis
 Status: Free Trial
Skills you'll gain: Key Performance Indicators (KPIs), Power BI, Dashboard, Data Visualization, Interactive Data Visualization, Data Storytelling, Data Presentation, Business Metrics, Performance Analysis, Data Visualization Software, Data Import/Export, Business Intelligence, Regional Sales, Sales Presentation
 Status: Free
Skills you'll gain: Blogs, Workflow Management, Data Visualization, User Feedback, Content Development and Management, Interactive Data Visualization, Data Integration, Cloud-Based Integration, Google Docs, Project Management Software, Social Media Management, Content Management, Ideation, Project Management, Customer Insights, Database Management
 Status: Free Trial
Skills you'll gain: Business Intelligence, Data Presentation, Data Storytelling, Interactive Data Visualization, Data Visualization Software, Business Analytics, Power BI, Pivot Tables And Charts, Dashboard, Key Performance Indicators (KPIs), Performance Reporting, Data Analysis, Scatter Plots, Business Reporting, Trend Analysis, Time Series Analysis and Forecasting
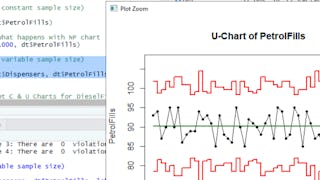
Skills you'll gain: Statistical Process Controls, Six Sigma Methodology, Quality Control, Plot (Graphics), Data Literacy, Statistical Analysis, R Programming
 Status: Free
Skills you'll gain: Microsoft Copilot, Microsoft Excel, Data Cleansing, Data Visualization Software, Spreadsheet Software, Trend Analysis, Forecasting, Data Manipulation, Sales, Data Analysis, Artificial Intelligence
 Status: New
Skills you'll gain: Data Visualization, Microsoft PowerPoint, Data Storytelling, Microsoft Excel, Trend Analysis
 Status: Free Trial
Dartmouth College
Skills you'll gain: Talent Management, People Development, Professional Networking, Collaboration, Leadership Development, Team Motivation, Teamwork, People Management, Entrepreneurship, Innovation, Leadership and Management, Leadership, Creativity, Employee Coaching, Mentorship, Influencing, Employee Retention, Recruitment Strategies, Growth Strategies
 Status: Free Trial
University of Illinois Urbana-Champaign
Skills you'll gain: Digital Marketing, AI Personalization, MarTech, Consumer Behaviour, Marketing Strategies, Cross-Channel Marketing, Customer experience strategy (CX), Digital Advertising, Customer Engagement, Content Creation, Marketing Analytics, Social Media Content, Web Analytics, Content Strategy, Search Engine Optimization, Generative AI, Analytics, Data Analysis, Data Visualization, Data Collection

Skills you'll gain: Operational Analysis, Performance Analysis, Performance Improvement, Data Import/Export, Variance Analysis, Exploratory Data Analysis, Data Analysis, Financial Analysis, Operations Management, Operating Expense, Plot (Graphics), Waterfall Methodology

Google Cloud
Skills you'll gain: Data Visualization, Google Sheets, Data Visualization Software, Data Presentation, Pivot Tables And Charts, Spreadsheet Software, Google Workspace
In summary, here are 10 of our most popular chart courses
- Helm Masterclass - From Beginner to Advanced: Packt
- Python for Data Visualization and Analysis: Edureka
- Power BI for Beginners: Interactive Dashboard Fundamentals: Coursera
- Notion Integrations for Beginners: Manage a Blog Business: Coursera
- Power BI: Data Visualization and Analysis: Whizlabs
- RStudio for Six Sigma - Control Charts: Coursera
- Copilot for Beginners: Sales Data Analysis in Excel: Coursera
- PowerPoint Data Viz – Business Charting Techniques: Packt
- Superbosses: Managing Talent & Leadership: Dartmouth College
- Digital Marketing: Customer: University of Illinois Urbana-Champaign


