• For Individuals
  • For Businesses
  • For Universities
  • For Governments
Degrees
​
Log In
Join for Free
  • Browse
  • Visualisation

Results for "visualisation"


  • Status: New
    New
    P

    Packt

    PowerPoint Data Viz – Business Charting Techniques

    Skills you'll gain: Data Visualization, Microsoft PowerPoint, Data Storytelling, Microsoft Excel, Trend Analysis

    Intermediate · Course · 3 - 6 Months

  • Status: Free Trial
    Free Trial
    B

    Board Infinity

    Data Interpretation & Insights: Exam & Recruitment Prep

    Skills you'll gain: Data Literacy, Data Analysis, Trend Analysis, Data Presentation, Analytical Skills, Analysis, Data Visualization, Logical Reasoning, Arithmetic, Estimation, Decision Making

    Beginner · Course · 1 - 4 Weeks

  • C

    Coursera

    Simple Parallel Coordinates Plot using d3 js

    Skills you'll gain: Data Visualization, Data Visualization Software, Data Presentation, Interactive Data Visualization, Data Literacy, Visualization (Computer Graphics), Javascript, Data Analysis, Microsoft Visual Studio

    Intermediate · Guided Project · Less Than 2 Hours

  • Status: New
    New
    Status: Free Trial
    Free Trial
    P

    Packt

    Intermediate Python – Libraries, Tools & Practical Projects

    Skills you'll gain: NumPy, Pandas (Python Package), Image Analysis, Data Manipulation, Matplotlib, Computer Vision, Data Analysis, Interactive Data Visualization, Python Programming, Data Visualization, JSON, Dashboard, Data Visualization Software, Jupyter, Web Applications

    Intermediate · Course · 1 - 3 Months

  • Status: New
    New
    P

    Packt

    Data Storytelling for Data Professionals

    Skills you'll gain: Data Storytelling, Data Presentation, Storytelling, Interactive Data Visualization, Data Visualization, Infographics, Dashboard, Data Visualization Software, Presentations, Data-Driven Decision-Making, Persuasive Communication

    Intermediate · Course · 1 - 4 Weeks

  • C

    Coursera

    Design corporate presentations with Piktochart

    Skills you'll gain: Presentations, Data Visualization, Corporate Communications, Data Storytelling, Sales Presentation, Sales Presentations, Business Communication, Company, Product, and Service Knowledge, Marketing Communications

    Beginner · Guided Project · Less Than 2 Hours

  • C

    Coursera

    Créez des infographies avec Piktochart

    Skills you'll gain: Infographics, Diagram Design, Data Visualization, Data Sharing, Graphic and Visual Design Software, Graphic Design, Business Analytics

    Beginner · Guided Project · Less Than 2 Hours

  • Status: Free
    Free
    C

    Coursera

    Notion Integrations for Beginners: Manage a Blog Business

    Skills you'll gain: Blogs, Workflow Management, Data Visualization, User Feedback, Content Development and Management, Interactive Data Visualization, Data Integration, Cloud-Based Integration, Google Docs, Project Management Software, Social Media Management, Content Management, Ideation, Project Management, Customer Insights, Database Management

    Beginner · Guided Project · Less Than 2 Hours

  • G

    Google Cloud

    Connected Sheets: Qwik Start

    Skills you'll gain: Google Sheets, Pivot Tables And Charts, Big Data, Data Analysis, Excel Formulas, Data Import/Export, Data Visualization, Real Time Data, Network Analysis, SQL

    Beginner · Project · Less Than 2 Hours

  • G

    Google Cloud

    Sending and Scheduling Dashboards in Looker

    Skills you'll gain: Looker (Software), Dashboard, Data Presentation, Data Visualization, Data Visualization Software, Google Cloud Platform, Data Sharing, Data Analysis, Cloud Computing

    Beginner · Project · Less Than 2 Hours

  • C

    Coursera

    Cómo importar datos y crear visualizaciones en Python

    Skills you'll gain: Matplotlib, Data Visualization Software, Data Visualization, Pandas (Python Package), Jupyter, Data Import/Export, Data Science, Data Analysis, Analytical Skills, Python Programming, Scripting

    Beginner · Guided Project · Less Than 2 Hours

  • Status: Free Trial
    Free Trial
    G

    Google Cloud

    Google Sheets 日本語版

    Skills you'll gain: Google Sheets, Google Workspace, Spreadsheet Software, Excel Formulas, Data Visualization, Data Management, Business Solutions, Collaborative Software, Data Sharing, Data Import/Export, Version Control

    Beginner · Course · 1 - 3 Months

Searches related to visualisation

data visualisation
biomedical visualisation
excel visualisation
medical visualisation
data visualisation and analytics
data visualization
visualization
data visualization with tableau
1…717273…79

In summary, here are 10 of our most popular visualisation courses

  • PowerPoint Data Viz – Business Charting Techniques: Packt
  • Data Interpretation & Insights: Exam & Recruitment Prep: Board Infinity
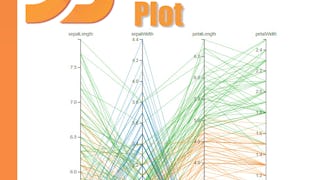
  • Simple Parallel Coordinates Plot using d3 js: Coursera
  • Intermediate Python – Libraries, Tools & Practical Projects: Packt
  • Data Storytelling for Data Professionals: Packt
  • Design corporate presentations with Piktochart: Coursera
  • Créez des infographies avec Piktochart: Coursera
  • Notion Integrations for Beginners: Manage a Blog Business: Coursera
  • Connected Sheets: Qwik Start: Google Cloud
  • Sending and Scheduling Dashboards in Looker: Google Cloud

Other topics to explore

Arts and Humanities
338 courses
Business
1095 courses
Computer Science
668 courses
Data Science
425 courses
Information Technology
145 courses
Health
471 courses
Math and Logic
70 courses
Personal Development
137 courses
Physical Science and Engineering
413 courses
Social Sciences
401 courses
Language Learning
150 courses

Coursera Footer

Skills

  • Artificial Intelligence (AI)
  • Cybersecurity
  • Data Analytics
  • Digital Marketing
  • English Speaking
  • Generative AI (GenAI)
  • Microsoft Excel
  • Microsoft Power BI
  • Project Management
  • Python

Certificates & Programs

  • Google Cybersecurity Certificate
  • Google Data Analytics Certificate
  • Google IT Support Certificate
  • Google Project Management Certificate
  • Google UX Design Certificate
  • IBM Data Analyst Certificate
  • IBM Data Science Certificate
  • Machine Learning Certificate
  • Microsoft Power BI Data Analyst Certificate
  • UI / UX Design Certificate

Industries & Careers

  • Business
  • Computer Science
  • Data Science
  • Education & Teaching
  • Engineering
  • Finance
  • Healthcare
  • Human Resources (HR)
  • Information Technology (IT)
  • Marketing

Career Resources

  • Career Aptitude Test
  • Examples of Strengths and Weaknesses for Job Interviews
  • High-Income Skills to Learn
  • How Does Cryptocurrency Work?
  • How to Highlight Duplicates in Google Sheets
  • How to Learn Artificial Intelligence
  • Popular Cybersecurity Certifications
  • Preparing for the PMP Certification
  • Signs You Will Get the Job After an Interview
  • What Is Artificial Intelligence?

Coursera

  • About
  • What We Offer
  • Leadership
  • Careers
  • Catalog
  • Coursera Plus
  • Professional Certificates
  • MasterTrack® Certificates
  • Degrees
  • For Enterprise
  • For Government
  • For Campus
  • Become a Partner
  • Social Impact
  • Free Courses
  • Share your Coursera learning story

Community

  • Learners
  • Partners
  • Beta Testers
  • Blog
  • The Coursera Podcast
  • Tech Blog

More

  • Press
  • Investors
  • Terms
  • Privacy
  • Help
  • Accessibility
  • Contact
  • Articles
  • Directory
  • Affiliates
  • Modern Slavery Statement
  • Do Not Sell/Share
Learn Anywhere
Download on the App Store
Get it on Google Play
Logo of Certified B Corporation
© 2026 Coursera Inc. All rights reserved.
  • Coursera Facebook
  • Coursera Linkedin
  • Coursera Twitter
  • Coursera YouTube
  • Coursera Instagram
  • Coursera TikTok