• For Individuals
  • For Businesses
  • For Universities
  • For Governments
Degrees
​
Log In
Join for Free
  • Browse
  • Visualisation

Results for "visualisation"


  • Status: New
    New
    P

    Packt

    AI Engineer Explorer Course

    Skills you'll gain: Model Evaluation, Matplotlib, Applied Machine Learning, Data Visualization, Supervised Learning, Statistics, Data Preprocessing

    Intermediate · Course · 1 - 3 Months

  • Status: Preview
    Preview
    S

    Siemens

    Dynamique des fluides numérique appliquée

    Skills you'll gain: Thermal Management, Finite Element Methods, Engineering Analysis, Mechanical Engineering, Engineering, Scientific Visualization, Simulations, Numerical Analysis, Mathematical Modeling, Differential Equations, Physics

    Intermediate · Course · 1 - 3 Months

  • Status: Preview
    Preview
    N

    Nikolai Schuler

    Microsoft Power BI Service - Publishing Reports to the Cloud

    Skills you'll gain: Power BI, Collaborative Software, Data Sharing, Microsoft 365, Cloud Services, Data Access, Cloud Deployment, Dashboard, Role-Based Access Control (RBAC), Data Security, Business Intelligence, Data Visualization, Data Modeling, Data Analysis

    Beginner · Course · 1 - 4 Weeks

  • Status: New
    New
    P

    Packt

    Data Meets Design – Business PowerPoint Skills

    Skills you'll gain: Data Visualization, Storytelling, Infographics, Layout Design, Branding

    Intermediate · Course · 3 - 6 Months

  • Status: New
    New
    Status: Preview
    Preview
    E

    EDUCBA

    Linear Regression & Predictive Modeling with SPSS

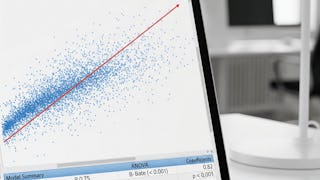
    Skills you'll gain: Data Visualization, Data Presentation, Regression Analysis, Predictive Modeling, Statistical Modeling, Forecasting, Financial Modeling, SPSS, Predictive Analytics, Risk Modeling, Statistical Analysis, Scatter Plots, Microsoft Excel

    Mixed · Course · 1 - 4 Weeks

  • G

    Google Cloud

    Looker Studio Pro Essentials - Español

    Skills you'll gain: Collaborative Software, Looker (Software), Data Visualization, Data Presentation, User Accounts, Security Controls, Scheduling, Authorization (Computing), Management Reporting, Customer Support, Administration, Data Sharing, Auditing

    Intermediate · Course · 1 - 3 Months

  • Status: Free Trial
    Free Trial
    W

    Whizlabs

    AWS: Analytics and Application Integration

    Skills you'll gain: AWS Kinesis, Amazon Web Services, Real Time Data, Extract, Transform, Load, Data Processing, Dashboard, Full-Stack Web Development, Mobile Development Tools, Event-Driven Programming, Business Intelligence, Data Visualization

    Intermediate · Course · 1 - 4 Weeks

  • Status: Free
    Free
    C

    Coursera

    Responsive Design in Bootstrap: Create an Admin Dashboard

    Skills you'll gain: Chart.js, Responsive Web Design, Bootstrap (Front-End Framework), UI Components, Dashboard, HTML and CSS, Data Visualization, Web Design, Web Applications, User Interface (UI), Web Development

    Intermediate · Guided Project · Less Than 2 Hours

  • Status: Preview
    Preview
    U

    University of Virginia

    혁신을 위한 디자인 씽킹

    Skills you'll gain: Design Thinking, Creative Problem-Solving, Ideation, Innovation, Brainstorming, Strategic Thinking, Storytelling, Human Centered Design, Data Visualization, Growth Mindedness, A/B Testing

    Beginner · Course · 1 - 3 Months

  • Status: Preview
    Preview
    U

    Universidad Nacional Autónoma de México

    Pigmentos y fotones

    Skills you'll gain: Color Theory, Design Elements And Principles, Design, Materials science, Physical Science, Physics, Chemistry, Scientific Visualization, Science and Research, Art History, Image Analysis, Curiosity

    Beginner · Course · 1 - 4 Weeks

  • C

    Coursera

    Créer des infographies attrayantes avec Creately

    Skills you'll gain: Infographics, Process Design, Diagram Design, Business Process, Target Audience, Data Visualization, Content Creation, Timelines, Business Strategy

    Beginner · Guided Project · Less Than 2 Hours

  • Status: New
    New
    Status: Free Trial
    Free Trial
    E

    EDUCBA

    Octave for Machine Learning: Analyze & Visualize

    Skills you'll gain: Text Mining, Statistical Analysis, Data Visualization, Descriptive Statistics, Data Analysis, Computer Programming, Mathematical Software, Data Preprocessing, Data Manipulation, Linear Algebra, Software Installation

    Mixed · Course · 1 - 4 Weeks

Searches related to visualisation

data visualisation
biomedical visualisation
excel visualisation
medical visualisation
data visualisation and analytics
data visualization
visualization
data visualization with tableau
1…737475…79

In summary, here are 10 of our most popular visualisation courses

  • AI Engineer Explorer Course: Packt
  • Dynamique des fluides numérique appliquée: Siemens
  • Microsoft Power BI Service - Publishing Reports to the Cloud: Nikolai Schuler
  • Data Meets Design – Business PowerPoint Skills: Packt
  • Linear Regression & Predictive Modeling with SPSS: EDUCBA
  • Looker Studio Pro Essentials - Español: Google Cloud
  • AWS: Analytics and Application Integration: Whizlabs
  • Responsive Design in Bootstrap: Create an Admin Dashboard: Coursera
  • 혁신을 위한 디자인 씽킹: University of Virginia
  • Pigmentos y fotones : Universidad Nacional Autónoma de México

Other topics to explore

Arts and Humanities
338 courses
Business
1095 courses
Computer Science
668 courses
Data Science
425 courses
Information Technology
145 courses
Health
471 courses
Math and Logic
70 courses
Personal Development
137 courses
Physical Science and Engineering
413 courses
Social Sciences
401 courses
Language Learning
150 courses

Coursera Footer

Skills

  • Artificial Intelligence (AI)
  • Cybersecurity
  • Data Analytics
  • Digital Marketing
  • English Speaking
  • Generative AI (GenAI)
  • Microsoft Excel
  • Microsoft Power BI
  • Project Management
  • Python

Certificates & Programs

  • Google Cybersecurity Certificate
  • Google Data Analytics Certificate
  • Google IT Support Certificate
  • Google Project Management Certificate
  • Google UX Design Certificate
  • IBM Data Analyst Certificate
  • IBM Data Science Certificate
  • Machine Learning Certificate
  • Microsoft Power BI Data Analyst Certificate
  • UI / UX Design Certificate

Industries & Careers

  • Business
  • Computer Science
  • Data Science
  • Education & Teaching
  • Engineering
  • Finance
  • Healthcare
  • Human Resources (HR)
  • Information Technology (IT)
  • Marketing

Career Resources

  • Career Aptitude Test
  • Examples of Strengths and Weaknesses for Job Interviews
  • High-Income Skills to Learn
  • How Does Cryptocurrency Work?
  • How to Highlight Duplicates in Google Sheets
  • How to Learn Artificial Intelligence
  • Popular Cybersecurity Certifications
  • Preparing for the PMP Certification
  • Signs You Will Get the Job After an Interview
  • What Is Artificial Intelligence?

Coursera

  • About
  • What We Offer
  • Leadership
  • Careers
  • Catalog
  • Coursera Plus
  • Professional Certificates
  • MasterTrack® Certificates
  • Degrees
  • For Enterprise
  • For Government
  • For Campus
  • Become a Partner
  • Social Impact
  • Free Courses
  • Share your Coursera learning story

Community

  • Learners
  • Partners
  • Beta Testers
  • Blog
  • The Coursera Podcast
  • Tech Blog

More

  • Press
  • Investors
  • Terms
  • Privacy
  • Help
  • Accessibility
  • Contact
  • Articles
  • Directory
  • Affiliates
  • Modern Slavery Statement
  • Do Not Sell/Share
Learn Anywhere
Download on the App Store
Get it on Google Play
Logo of Certified B Corporation
© 2026 Coursera Inc. All rights reserved.
  • Coursera Facebook
  • Coursera Linkedin
  • Coursera Twitter
  • Coursera YouTube
  • Coursera Instagram
  • Coursera TikTok