
Filter by
The language used throughout the course, in both instruction and assessments.
Results for "motion+chart"

Coursera Project Network
Skills you'll gain: Timelines, Project Schedules, Scheduling, Project Management, Project Management Software, Project Planning, Coordinating, Dependency Analysis
Coursera Project Network
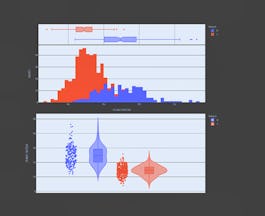
Skills you'll gain: Plotly, Plot (Graphics), Statistical Visualization, Box Plots, Scatter Plots, Interactive Data Visualization, Data Visualization Software, Histogram

Google Cloud
Skills you'll gain: Google Sheets, Data Visualization Software, Pivot Tables And Charts, Spreadsheet Software, Google Workspace

Skills you'll gain: Data Storytelling, Interactive Data Visualization, Tableau Software, Data Visualization Software, Dashboard, Data Integration, Tree Maps, Advanced Analytics, Exploratory Data Analysis, Heat Maps, Data Mapping, Data Import/Export, Correlation Analysis
Coursera Project Network
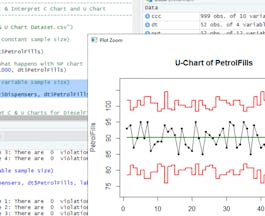
Skills you'll gain: Statistical Process Controls, Six Sigma Methodology, Quality Control, Plot (Graphics), Statistical Analysis, R Programming
 Status: Free
Coursera Project Network
Skills you'll gain: Dashboard, Interactive Data Visualization, Data Presentation, Tableau Software, Data Visualization Software, Exploratory Data Analysis, Data Analysis


University of Pennsylvania
Skills you'll gain: Data Storytelling, Data Presentation, Data Visualization Software, Tableau Software, Presentations, Interactive Data Visualization, Verbal Communication Skills, Statistical Visualization, Storytelling, Persuasive Communication, Chart.js, Data Analysis, Pivot Tables And Charts, Scatter Plots, Stakeholder Communications, Spatial Analysis, Trend Analysis, Forecasting

Skills you'll gain: Apple iOS, Swift Programming, Interactive Design, User Interface (UI), Mobile Development, Interaction Design, User Interface (UI) Design, Visualization (Computer Graphics), Computer Graphics


University of Colorado Boulder
Skills you'll gain: Simulations, Engineering Analysis, Engineering Calculations, Mathematical Modeling, Differential Equations, Applied Mathematics, Mathematical Theory & Analysis

Skills you'll gain: Data Storytelling, Alteryx, Dashboard, R Programming, Data Visualization Software, Interactive Data Visualization, Statistical Programming, Tableau Software, Data Analysis, Data Manipulation, Statistical Analysis, Data Cleansing, Data Integration, Workflow Management, Data Transformation, Data Import/Export, Data Structures

University of Colorado Boulder
Skills you'll gain: Process Control, Machine Controls, Vibrations, Systems Engineering, Risk Control, Mathematical Modeling, Simulation and Simulation Software, Engineering Analysis, Engineering Calculations, Engineering Design Process, Applied Mathematics

Skills you'll gain: Plot (Graphics), Data Visualization Software, Ggplot2, Statistical Visualization, R Programming, Scatter Plots, Regression Analysis, Data Manipulation, Statistical Programming, Statistical Analysis, Data Analysis, Data Import/Export, Exploratory Data Analysis, Development Environment, Data Structures

In summary, here are 10 of our most popular motion+chart courses
- Create a Gantt Chart with Lucidchart: Coursera Project Network
- Interactive Statistical Data Visualization 101: Coursera Project Network
- Use Charts in Google Sheets: Google Cloud
- Use Tableau for your Data Science Workflow: Edureka
- RStudio for Six Sigma - Control Charts: Coursera Project Network
- Dynamic Dashboards with Tableau: Advanced Sales Analysis: Coursera Project Network
- Data Viz Using Tableau & Presenting With Storytelling: University of Pennsylvania
- SwiftUI Animations iOS 16 - Animate Anything with SwiftUI: Packt
- Spacecraft Relative Motion Control: University of Colorado Boulder
- Data Analytics and Visualization with Tableau and more: Packt


