Results for "interactive+visualization+design"
 Status: Free Trial
Skills you'll gain: Business Intelligence, Data Presentation, Data Storytelling, Interactive Data Visualization, Data Visualization Software, Business Analytics, Power BI, Pivot Tables And Charts, Dashboard, Key Performance Indicators (KPIs), Performance Reporting, Data Analysis, Scatter Plots, Business Reporting, Trend Analysis, Time Series Analysis and Forecasting
 Status: NewStatus: Free Trial
Skills you'll gain: User Interface (UI) Design, Mobile Development, User Interface and User Experience (UI/UX) Design, iOS Development, Swift Programming, Responsive Web Design, Application Design, Animations, Interactive Design, Application Development
 Status: Free Trial
University of Colorado Boulder
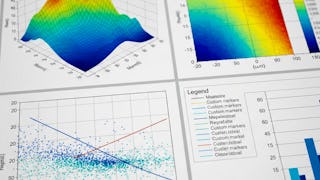
Skills you'll gain: Matplotlib, Plotly, Seaborn, Data Visualization Software, Data Visualization, Statistical Visualization, Interactive Data Visualization, Scatter Plots, Box Plots, Heat Maps, Histogram
 Status: Free Trial
Skills you'll gain: Matplotlib, Plot (Graphics), Scientific Visualization, Data Visualization, Data Presentation
In summary, here are 4 of our most popular interactive+visualization+design courses
- Power BI: Data Visualization and Analysis: Whizlabs
- UI Design, Localization & Capstone UIs: Packt
- BiteSize Python: Data Visualization: University of Colorado Boulder
- Advanced Matplotlib: Design & Customize Visualizations: EDUCBA


