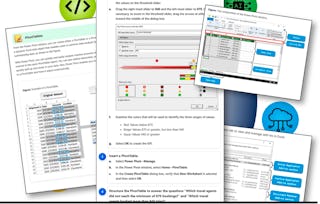
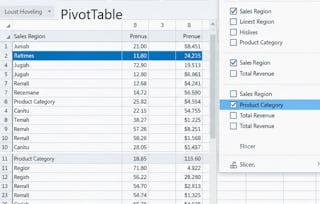
This course provides step-by-step instructions for how to set-up a business intelligence dashboard in Excel using the Power Pivot add-on. You’ll learn the key functions and best practices for setting-up a dashboard. As you progress through the course, you’ll apply everything you’ve learned to a hands-on example using data we provide. By the end of this course, you’ll walk away with everything you need to create your own dashboards in Excel—so you can analyze and present data, track KPIs, and make your data easily accessible.

Power Pivot Fundamentals

Power Pivot Fundamentals
This course is part of Data Skills for Excel Professionals Specialization
Instructor: CFI (Corporate Finance Institute)
3,667 already enrolled
Included with
35 reviews
Skills you'll gain
Details to know

Add to your LinkedIn profile
4 assignments
See how employees at top companies are mastering in-demand skills

Build your subject-matter expertise
- Learn new concepts from industry experts
- Gain a foundational understanding of a subject or tool
- Develop job-relevant skills with hands-on projects
- Earn a shareable career certificate

There are 7 modules in this course
In this module, you'll explore how Power Pivot transforms Microsoft Excel, bringing business intelligence and analysis capabilities to the forefront. Discover the key benefits, from creating pivot tables with multiple sources to performing powerful time period comparisons, and elevate your analysis skills to the next level with simple formulas and advanced functionalities.
What's included
4 videos1 reading
Dive into the world of data modeling as we guide you through the process of building a relational data model in Power Pivot. Unleash the power of new functionalities and learn to import, relate, summarize, and interact with your data using measures, tables, and slicers for enhanced Excel capabilities.
What's included
12 videos
Welcome to the next chapter of our Power Pivot Mastery course! Now that you've mastered data consolidation and interaction, this chapter delves into the world of DAX measures. Learn how to create metrics, leverage DAX as a powerful formula language, and unlock new possibilities for data aggregation and analysis in your Excel data model.
What's included
13 videos1 assignment
Welcome to our Advanced Power Pivot Techniques module! Building upon your understanding of the Power Pivot data model and DAX, explore how to efficiently aggregate and summarize data with reusable formulas. This chapter introduces the Star Schema data model, guiding you through expanding datasets, managing multiple dimension tables, and creating interactive dashboards with a logical flow. Learn the significance of the Star Schema, leverage timelines, pivot charts, and enhance data import efficiency by combining Power Query with Power Pivot for a cohesive and consistent dashboard experience.
What's included
21 videos1 assignment
In this module, explore the art of turning data into meaningful insights and compelling data stories. Learn to create advanced DAX measures, employ the CALCULATE function for percent of total calculations, delve into DAX Time Intelligence for year-over-year comparisons, and enhance dashboard aesthetics with conditional formatting, KPIs, and visual cues. Elevate your data presentation skills and gain a solid foundation for crafting professional-looking dashboards that communicate insights effectively.
What's included
13 videos
Welcome to the end-of-course exercise! Apply your skills to the Big Wings Airline case study, where you'll independently create a competitor analysis dashboard. Utilize your data modeling, metrics creation, and dashboard formatting knowledge to meet the provided requirements and communicate key insights effectively. Happy practicing!
What's included
2 videos
Congratulations on completing our Power Pivot course! You've mastered the art of building three insightful dashboards, creating data models, understanding DAX basics, and delving into time intelligence calculations.
What's included
1 video1 reading2 assignments
Earn a career certificate
Add this credential to your LinkedIn profile, resume, or CV. Share it on social media and in your performance review.
Instructor
Offered by
Explore more from Finance
 Status: Free Trial
 Status: Free Trial
Logical Operations
 Status: Free Trial
 Status: Free Trial
Logical Operations
Why people choose Coursera for their career

Felipe M.

Jennifer J.

Larry W.

Chaitanya A.
Learner reviews
- 5 stars
85.71%
- 4 stars
5.71%
- 3 stars
0%
- 2 stars
2.85%
- 1 star
5.71%
Showing 3 of 35
Reviewed on Oct 14, 2025
Pros: explanations by the instructor are clear. Exercices provided to practice the notions learned during the class.
Reviewed on Oct 4, 2025
Concisely explained but the practice questions are rigorous and they require you to put into practice what you have learnt.

Open new doors with Coursera Plus
Unlimited access to 10,000+ world-class courses, hands-on projects, and job-ready certificate programs - all included in your subscription
Advance your career with an online degree
Earn a degree from world-class universities - 100% online
Join over 3,400 global companies that choose Coursera for Business
Upskill your employees to excel in the digital economy
Frequently asked questions
To access the course materials, assignments and to earn a Certificate, you will need to purchase the Certificate experience when you enroll in a course. You can try a Free Trial instead, or apply for Financial Aid. The course may offer 'Full Course, No Certificate' instead. This option lets you see all course materials, submit required assessments, and get a final grade. This also means that you will not be able to purchase a Certificate experience.
When you enroll in the course, you get access to all of the courses in the Specialization, and you earn a certificate when you complete the work. Your electronic Certificate will be added to your Accomplishments page - from there, you can print your Certificate or add it to your LinkedIn profile.
Yes. In select learning programs, you can apply for financial aid or a scholarship if you can’t afford the enrollment fee. If fin aid or scholarship is available for your learning program selection, you’ll find a link to apply on the description page.
More questions
Financial aid available,

