What Is Programming? And How To Get Started
January 28, 2025
Article
Recommended experience
Intermediate level
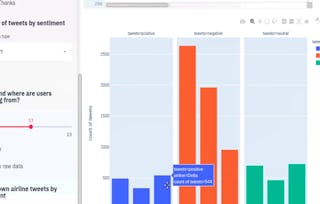
Ideal for those looking to present data analyses through interactive, web-based dashboards using Plotly Dash. Basic Python knowledge is recommended.
Recommended experience
Intermediate level
Ideal for those looking to present data analyses through interactive, web-based dashboards using Plotly Dash. Basic Python knowledge is recommended.
Identify the core components and structure of a Plotly Dash dashboard.
Explain the role of callbacks in making dashboards interactive.
Break down complex dashboard layouts into manageable sections using HTML and CSS.
Assess the effectiveness of dashboard interactivity through real-time data updates.
Add to your LinkedIn profile
October 2024
4 assignments
Add this credential to your LinkedIn profile, resume, or CV
Share it on social media and in your performance review
Dive into the world of interactive data visualization with this hands-on course designed to teach you how to create sophisticated dashboards using Plotly Dash in Python. You’ll start with a Python crash course, ensuring you have a solid foundation in the language, covering essential topics like data types, loops, and functions. This will equip you with the necessary skills to smoothly transition into dashboard development.
As you advance, you’ll be introduced to Plotly Dash, where you’ll learn how to build and layout your first dashboard. The course emphasizes interactivity, teaching you how to use callbacks to create responsive elements, and how to incorporate HTML and core components to design dynamic user interfaces. You’ll also explore how to make your dashboards visually appealing through CSS customization, grid layouts, and navigation elements. To solidify your learning, the course offers capstone projects and case studies, such as creating an interactive map and a live-updating financial dashboard. These projects provide real-world scenarios where you can apply your skills and see the practical impact of your work. By the end of the course, you'll be confident in building and customizing powerful dashboards that bring data to life. This course is ideal for data analysts, data scientists, and software developers who have a basic understanding of Python and wish to enhance their data visualization skills. No prior experience with Plotly Dash is required, but a fundamental knowledge of Python programming is recommended.
In this module, we will set the stage for your learning journey by introducing you to the course and its author. You'll get a clear overview of what to expect from the course and how it will empower you to create interactive dashboards using Plotly Dash.
2 videos1 reading
In this module, we will dive into the essential Python concepts you'll need to build interactive dashboards. You'll learn how to set up your Python environment and get comfortable with data types, control structures, and functions, which are crucial for effective data manipulation and visualization.
6 videos
In this module, we will introduce you to Plotly Dash, a powerful framework for building interactive dashboards. You'll learn what Dash is and how it simplifies the process of creating data-driven applications. By the end of this section, you'll have built your first dashboard, setting a strong foundation for more advanced projects.
2 videos
In this module, we will delve into the layout-building aspects of Dash, focusing on both HTML and core components. You'll gain an understanding of how these elements come together to form the structure of your dashboards, enabling you to create layouts that are both functional and user-friendly.
2 videos1 assignment
In this module, we will explore how to bring your dashboards to life by making them interactive using callbacks in Plotly Dash. You'll start by learning the basics of callbacks, then progressively build more complex interactions, including multi-input/output callbacks, chaining, and using States to control dashboard behavior. By the end of this section, your dashboards will be highly interactive and user-responsive.
6 videos
In this module, we will guide you through the Avocado Prices dashboard project, your first capstone task. You'll get an overview of the project requirements and begin applying all the concepts and tools you've learned. This capstone project will solidify your understanding and give you practical experience in building a complete interactive dashboard using Plotly Dash.
1 video
In this module, we will focus on enhancing the visual appeal and user experience of your dashboards by customizing their look and feel. You'll learn various techniques for applying CSS, both inline and external, and how to create sophisticated layouts like grids, navigation bars, and card decks. These skills will help you create polished, professional dashboards that are not only functional but also aesthetically pleasing.
5 videos1 assignment
In this module, we will walk through a detailed case study of creating an interactive map dashboard. You'll learn how to set up the layout with essential components like a RangeSlider, Choropleth map, and DataTable, and then make the dashboard interactive by adding callbacks. This case study will provide hands-on experience in building a complex, data-driven dashboard that responds dynamically to user inputs.
5 videos
In this module, we will guide you through creating a live updating financial dashboard. You'll learn how to set up the layout with essential components like input fields, candlestick charts, and tabs, and then implement live data updates using intervals and callbacks. This case study will equip you with the skills to build real-time dashboards that are critical for financial analysis and decision-making.
6 videos
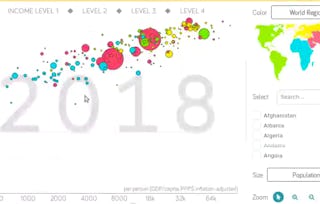
In this module, we will introduce your second capstone project, where you'll create a Life Expectancy dashboard. This project will challenge you to apply everything you've learned, from layout design to live updates, as you build a dashboard that provides insights into global health trends. By completing this capstone, you'll solidify your mastery of Plotly Dash and dashboard development.
1 video1 assignment
In this module, we will introduce you to Jupyter Dash, a powerful extension of Plotly Dash that allows you to build interactive dashboards within Jupyter notebooks. This bonus material will help you expand your toolkit, offering an alternative approach to dashboard development that combines the interactivity of Dash with the convenience of Jupyter notebooks.
1 video1 assignment
Packt helps tech professionals put software to work by distilling and sharing the working knowledge of their peers. Packt is an established global technical learning content provider, founded in Birmingham, UK, with over twenty years of experience delivering premium, rich content from groundbreaking authors on a wide range of emerging and popular technologies.
Coursera Instructor Network
Course
Coursera Project Network
Course
Coursera Project Network
Course
Board Infinity
Course
Unlimited access to 10,000+ world-class courses, hands-on projects, and job-ready certificate programs - all included in your subscription
Earn a degree from world-class universities - 100% online
Upskill your employees to excel in the digital economy
Yes, you can preview the first video and view the syllabus before you enroll. You must purchase the course to access content not included in the preview.
If you decide to enroll in the course before the session start date, you will have access to all of the lecture videos and readings for the course. You’ll be able to submit assignments once the session starts.
Once you enroll and your session begins, you will have access to all videos and other resources, including reading items and the course discussion forum. You’ll be able to view and submit practice assessments, and complete required graded assignments to earn a grade and a Course Certificate.
If you complete the course successfully, your electronic Course Certificate will be added to your Accomplishments page - from there, you can print your Course Certificate or add it to your LinkedIn profile.
This course is one of a few offered on Coursera that are currently available only to learners who have paid or received financial aid, when available.
You will be eligible for a full refund until two weeks after your payment date, or (for courses that have just launched) until two weeks after the first session of the course begins, whichever is later. You cannot receive a refund once you’ve earned a Course Certificate, even if you complete the course within the two-week refund period. See our full refund policy.
Yes. In select learning programs, you can apply for financial aid or a scholarship if you can’t afford the enrollment fee. If fin aid or scholarship is available for your learning program selection, you’ll find a link to apply on the description page.
These cookies are necessary for the website to function and cannot be switched off in our systems. They are usually only set in response to actions made by you which amount to a request for services, such as setting your privacy preferences, logging in or filling in forms. You can set your browser to block or alert you about these cookies, but some parts of the site will not then work.
These cookies may be set through our site by our advertising partners. They may be used by those companies to build a profile of your interests and show you relevant adverts on other sites. They are based on uniquely identifying your browser and internet device. If you do not allow these cookies, you will experience less targeted advertising.
These cookies allow us to count visits and traffic sources so we can measure and improve the performance of our site. They help us to know which pages are the most and least popular and see how visitors move around the site. If you do not allow these cookies we will not know when you have visited our site, and will not be able to monitor its performance.
These cookies enable the website to provide enhanced functionality and personalization. They may be set by us or by third party providers whose services we have added to our pages. If you do not allow these cookies then some or all of these services may not function properly.