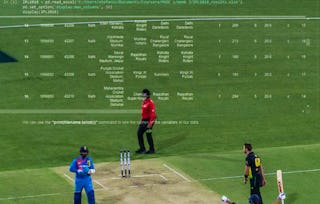
In this course the learner will be shown how to generate forecasts of game results in professional sports using Python. The main emphasis of the course is on teaching the method of logistic regression as a way of modeling game results, using data on team expenditures. The learner is taken through the process of modeling past results, and then using the model to forecast the outcome games not yet played. The course will show the learner how to evaluate the reliability of a model using data on betting odds. The analysis is applied first to the English Premier League, then the NBA and NHL. The course also provides an overview of the relationship between data analytics and gambling, its history and the social issues that arise in relation to sports betting, including the personal risks.

Prediction Models with Sports Data

Prediction Models with Sports Data
This course is part of Sports Performance Analytics Specialization


Instructors: Youngho Park
6,916 already enrolled
Included with
41 reviews
Recommended experience
What you'll learn
Learn how to generate forecasts of game results in professional sports using Python.
Skills you'll gain
Details to know

Add to your LinkedIn profile
5 assignments
See how employees at top companies are mastering in-demand skills

Build your subject-matter expertise
- Learn new concepts from industry experts
- Gain a foundational understanding of a subject or tool
- Develop job-relevant skills with hands-on projects
- Earn a shareable career certificate

There are 5 modules in this course
This module introduces the regression models in dealing with the categorical outcome variables in sport contest (i.e., Win, Draw, Lose). It explains the Linear Probability Model (LPM) in terms of its theoretical foundations, computational applications, and empirical limitations. Then the module introduces and demonstrates the Logistic Regression as a better substitute of LPM for the categorical dependent variables.
What's included
8 videos8 readings2 assignments6 ungraded labs
This module explores the relationship between probability and betting markets. It explains the concept of odds, and the relationship between betting odds and probabilities. It then develops a measure of the accuracy of betting odds using sports examples, and assesses the meaning of efficiency in betting markets.
What's included
6 videos3 readings1 assignment5 ungraded labs
This module shows how to forecast the outcome of EPL soccer games using an ordered logit model and publicly available information. It assesses the accuracy of these forecasts against the betting odds and shows that they are remarkably accurate.
What's included
7 videos3 readings1 assignment6 ungraded labs
This module assesses the efficacy of the EPL forecasting model covered in the previous week by replicating the model in the context of three North American team sports leagues (i.e., NHL, NBA, MLB). Specifically, this module shows how to forecast the outcome of NHL, NBA, MLB regular season games using an ordered logit model and publicly available information. It assesses the accuracy of these forecasts against the betting odds.
What's included
4 videos4 readings1 assignment4 ungraded labs
In this module we examine the historical and social consequences of gambling, and the relationship between gambling and statistics. Gambling is explored from the perspective of different ethical and religious systems. Issues of problem gambling are explored and assessed.
What's included
7 videos1 reading
Earn a career certificate
Add this credential to your LinkedIn profile, resume, or CV. Share it on social media and in your performance review.
Instructors


Offered by
Explore more from Data Analysis
 Status: Free Trial
University of Michigan
 Status: Free Trial
University of Michigan
 Status: Free Trial
University of Michigan
 Status: Free Trial
The State University of New York
Why people choose Coursera for their career

Felipe M.

Jennifer J.

Larry W.

Chaitanya A.
Learner reviews
- 5 stars
73.17%
- 4 stars
9.75%
- 3 stars
12.19%
- 2 stars
0%
- 1 star
4.87%
Showing 3 of 41
Reviewed on Apr 11, 2024
Very interesting course, even though some of the data prep is kind of weird it's nice to see things done a bit differently
Reviewed on Jul 10, 2023
I found the material from weeks 2 and 4 very interesting!

Open new doors with Coursera Plus
Unlimited access to 10,000+ world-class courses, hands-on projects, and job-ready certificate programs - all included in your subscription
Advance your career with an online degree
Earn a degree from world-class universities - 100% online
Join over 3,400 global companies that choose Coursera for Business
Upskill your employees to excel in the digital economy
Frequently asked questions
To access the course materials, assignments and to earn a Certificate, you will need to purchase the Certificate experience when you enroll in a course. You can try a Free Trial instead, or apply for Financial Aid. The course may offer 'Full Course, No Certificate' instead. This option lets you see all course materials, submit required assessments, and get a final grade. This also means that you will not be able to purchase a Certificate experience.
When you enroll in the course, you get access to all of the courses in the Specialization, and you earn a certificate when you complete the work. Your electronic Certificate will be added to your Accomplishments page - from there, you can print your Certificate or add it to your LinkedIn profile.
Yes. In select learning programs, you can apply for financial aid or a scholarship if you can’t afford the enrollment fee. If fin aid or scholarship is available for your learning program selection, you’ll find a link to apply on the description page.
More questions
Financial aid available,

