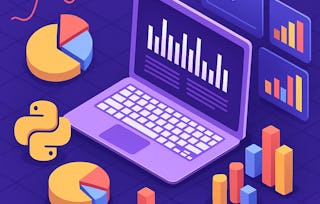
In today's data-driven world, the ability to create compelling visualizations and tell impactful stories with data is a crucial skill. This comprehensive course will guide you through the process of visualization using coding tools with Python, spreadsheets, and BI (Business Intelligence) tooling. Whether you are a data analyst, a business professional, or an aspiring data storyteller, this course will provide you with the knowledge and best practices to excel in the art of visual storytelling.

Data Visualization with Python

Data Visualization with Python
This course is part of Applied Python Data Engineering Specialization


Instructors: Matt Harrison
Access provided by EmployNV
4,420 already enrolled
25 reviews
Recommended experience
What you'll learn
Apply Python, spreadsheets, and BI tooling proficiently to create visually compelling and interactive data visualizations.
Formulate and communicate data-driven insights and narratives through impactful visualizations and data storytelling.
Assess and select the most suitable visualization tools and techniques to address organizational data needs and objectives.
Skills you'll gain
- Scatter Plots
- Data Analysis
- Data Visualization
- Statistical Visualization
- Tableau Software
- Histogram
- Business Communication
- Dashboard
- Cloud Applications
- Seaborn
- Python Programming
- Plotly
- Google Sheets
- Heat Maps
- Data Storytelling
- Matplotlib
- Plot (Graphics)
- Interactive Data Visualization
- Data Presentation
- Data Visualization Software
Details to know

Add to your LinkedIn profile
4 assignments
See how employees at top companies are mastering in-demand skills

Build your subject-matter expertise
- Learn new concepts from industry experts
- Gain a foundational understanding of a subject or tool
- Develop job-relevant skills with hands-on projects
- Earn a shareable career certificate

There are 4 modules in this course
In this module, we will introduce you to the fundamentals of data visualization and provide step-by-step guidance on how to get started with creating basic plots in Excel and Google Sheets. Whether you are new to data visualization or looking to enhance your skills, this week will lay the groundwork for effective visual storytelling using these widely accessible tools.
What's included
13 videos8 readings1 assignment2 discussion prompts
In this module, you will embark on an exciting journey of learning as you explore data visualization using Pandas, Seaborn and Matplotlib. You will use Pandas and Seaborn to construct histograms, which will allow you to gain insights into the distribution of your numerical data. You will also delve into scatterplots, enabling you to visualize the relationships between different variables in your datasets and identify patterns and correlations. Lastly, you will learn how to utilize line plots to capture temporal trends and changes over time, enhancing your ability to communicate data-driven narratives effectively.
What's included
19 videos7 readings1 assignment1 discussion prompt
In this module, you will explore the powerful combination of Plotly, Dash, and Streamlit for creating interactive and dynamic visualizations within a dashboard. You will use Plotly to create visually appealing histograms, scatterplots, and line plots that can be embedded within a dashboard. You will also dive into Dash and Streamlit, two popular Python frameworks for building interactive web-based dashboards. By the end of the week, you will be able to apply your knowledge and create a comprehensive dashboard that incorporates these visualizations, enabling users to explore and interact with your data.
What's included
15 videos6 readings1 assignment1 discussion prompt
In this module, you will dive into two cloud-based tools, Tableau and Amazon QuickSight, to create compelling visualizations, and gain insights from your data in a user-friendly and interactive manner. You will first use Tableau to design and create histograms, scatterplots, and line plots that effectively showcase your data. You will then use Amazon QuickSight, an intuitive and cloud-based business intelligence tool, to create visually appealing and interactive visualizations. By the end of the week, you will be able to apply your knowledge and create captivating visualizations using these platforms.
What's included
14 videos6 readings1 assignment1 discussion prompt
Earn a career certificate
Add this credential to your LinkedIn profile, resume, or CV. Share it on social media and in your performance review.
Offered by
Why people choose Coursera for their career

Felipe M.

Jennifer J.

Larry W.

Chaitanya A.
Learner reviews
- 5 stars
60%
- 4 stars
16%
- 3 stars
12%
- 2 stars
4%
- 1 star
8%
Showing 3 of 25
Reviewed on Aug 28, 2024
Great course, learnt a lot of practical skills through real-life examples
Explore more from Data Science

University of Pittsburgh


