Pandas is an essential library for data manipulation and analysis in Python. It is renowned for its capabilities to handle and process large datasets efficiently. Whether you're a beginner or a seasoned data professional, Pandas provides flexible data structures and functions that make data analysis seamless and straightforward.
If you're ready to learn more, consider enrolling in the Applied Data Science with Python Specialization from the University of Michigan, where you'll learn to apply data science methods and techniques and acquire analysis skills.
Pandas cheat sheet
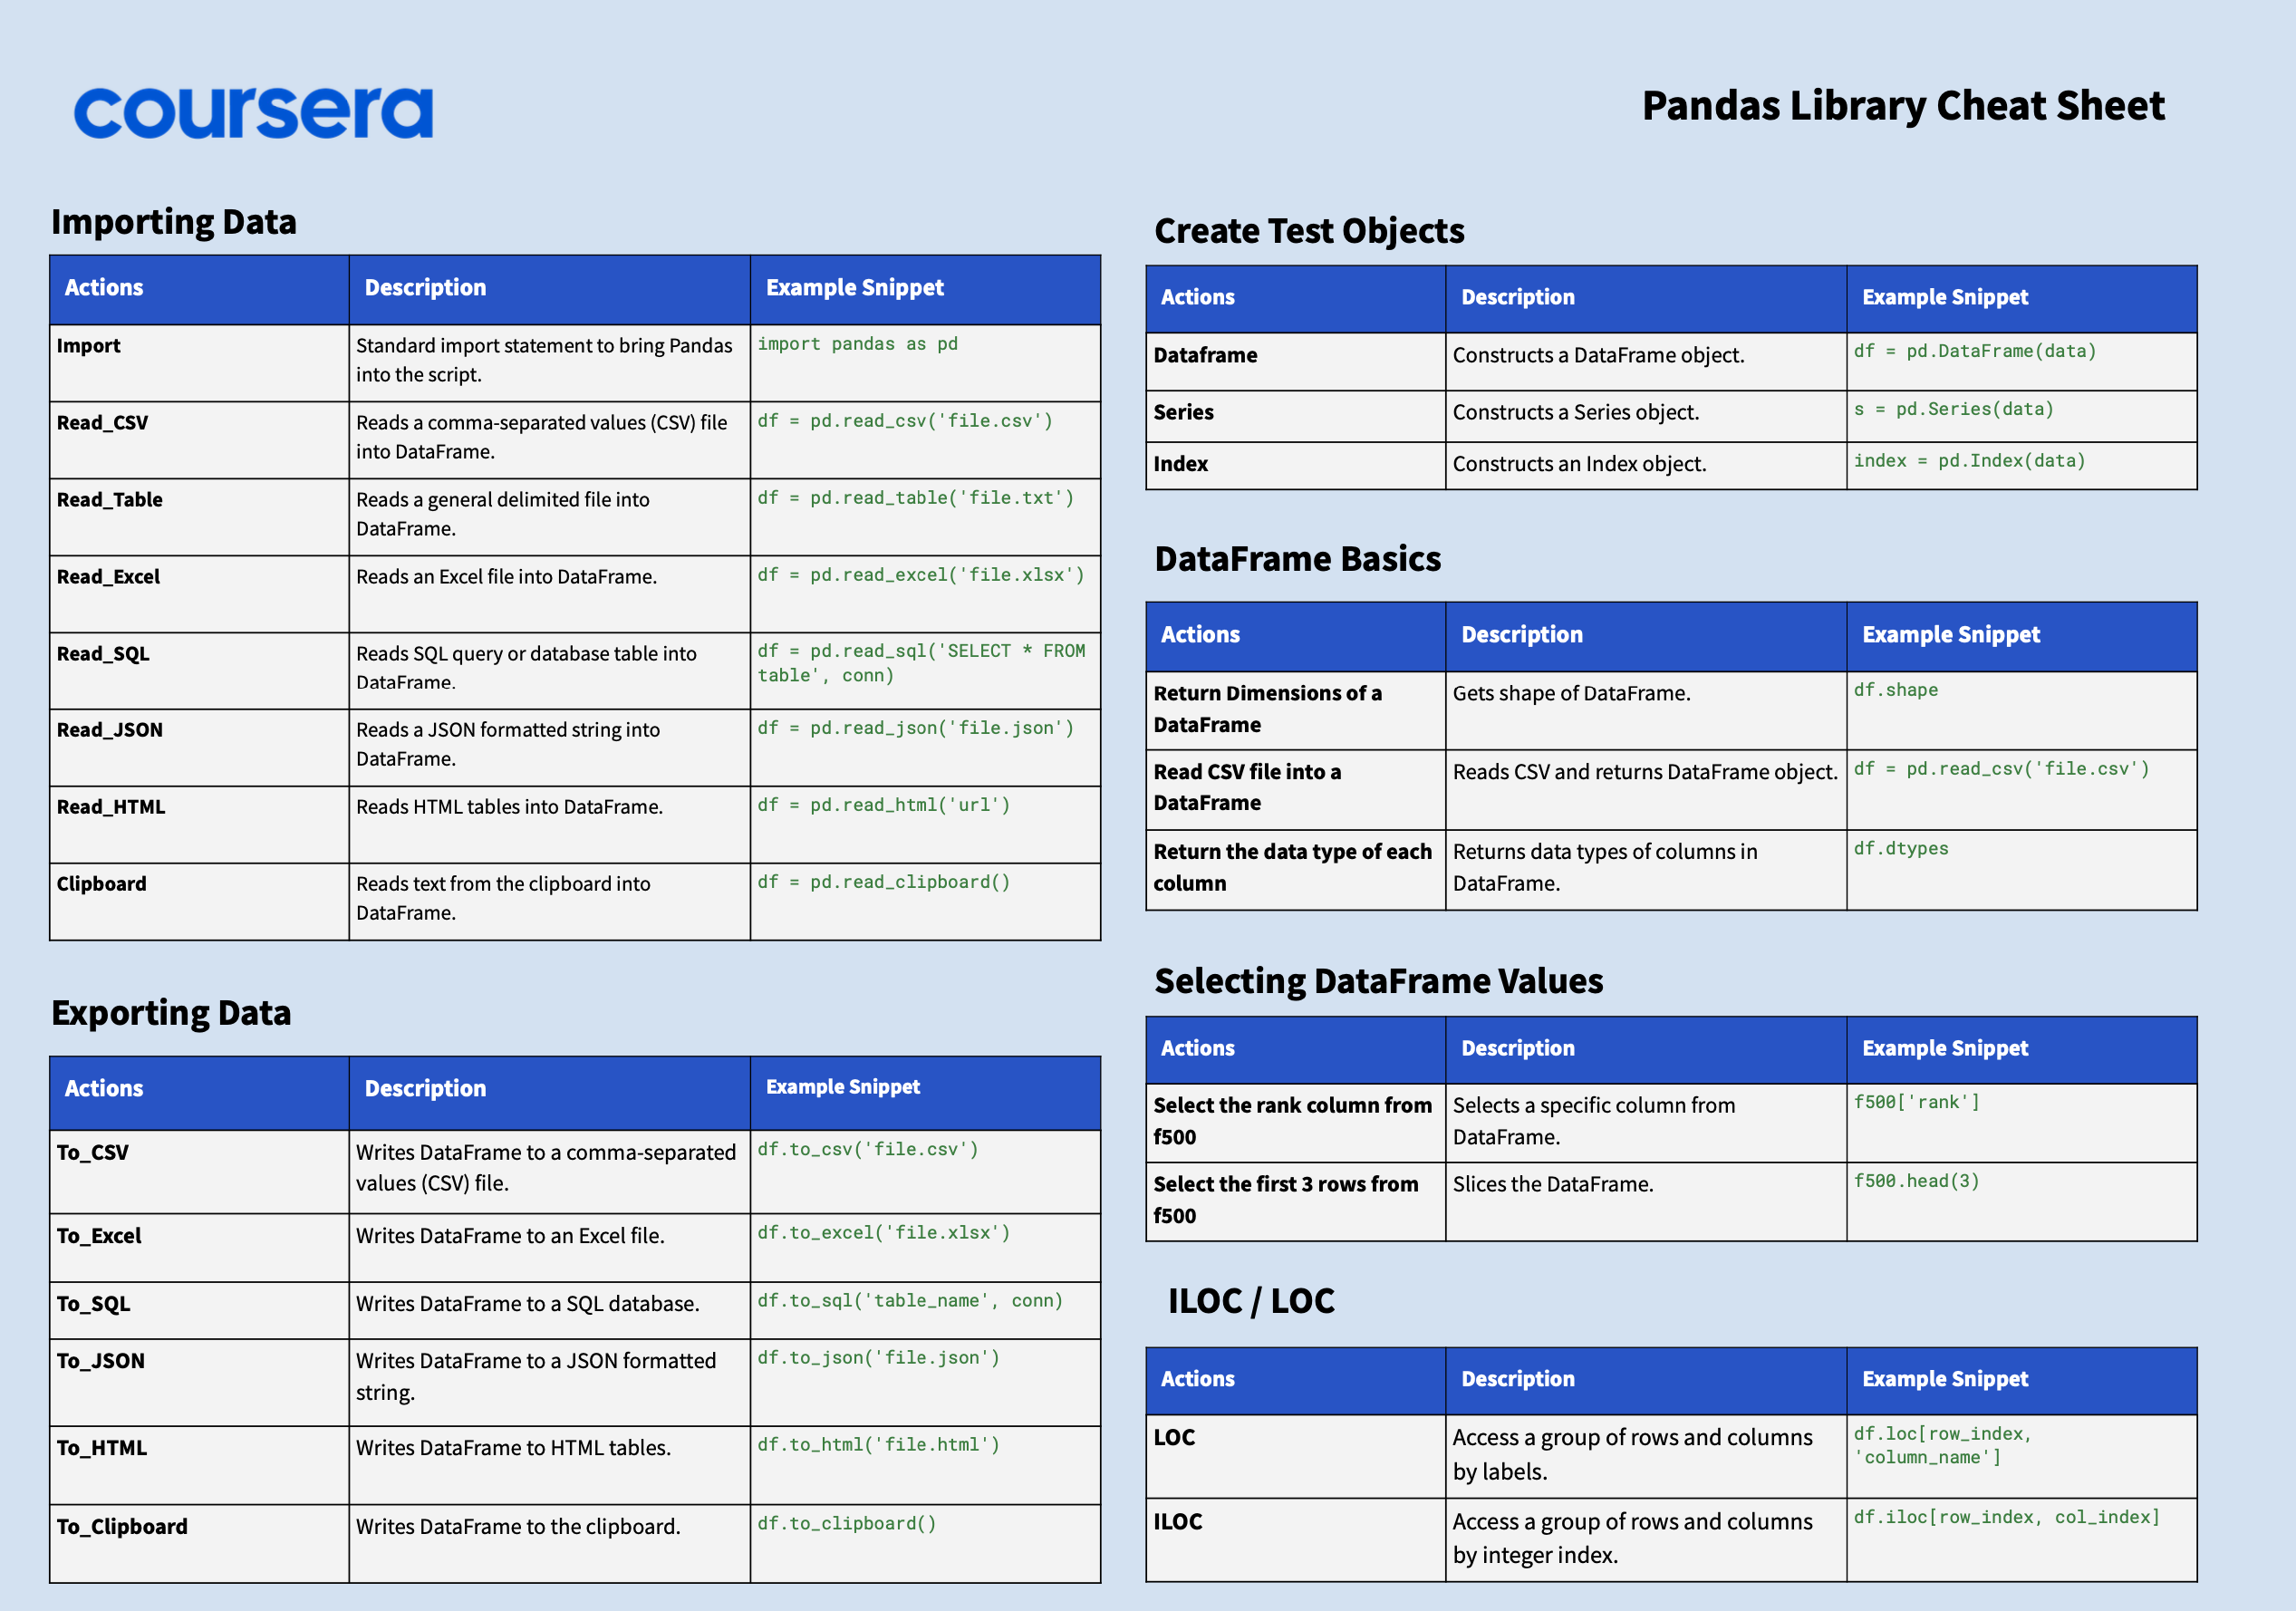
Use the following Pandas cheat sheet to quickly reference some of the most common operations you might perform with the Pandas library.
Click to download
Importing Data
| Action |
Definition |
Example Code Snippet |
| Import |
Standard import statement to bring Pandas into the script |
import pandas as pd |
| Read_CSV |
Reads a comma-separated values (CSV) file into DataFrame |
df = pd.read_csv('file.csv') |
| Read_Table |
Reads a general delimited file into DataFrame |
df = pd.read_table('file.txt') |
| Read_Excel |
Reads an Excel file into DataFrame |
df = pd.read_excel('file.xlsx') |
| Read_SQL |
Reads SQL query or database table into DataFrame |
df = pd.read_sql('SELECT * FROM table', conn) |
| Read_JSON |
Reads a JSON formatted string into DataFrame |
df = pd.read_json('file.json') |
| Read_HTML |
Reads HTML tables into DataFrame |
df = pd.read_html('url') |
| Clipboard |
Reads text from the clipboard into DataFrame |
df = pd.read_clipboard() |
Exporting Data
| Action |
Definition |
Example Code Snippet |
| To_CSV |
Writes DataFrame to a comma-separated values (CSV) file |
df.to_csv('file.csv') |
| To_Excel |
Writes DataFrame to an Excel file |
df.to_excel('file.xlsx') |
| To_SQL |
Writes DataFrame to a SQL database |
df.to_sql('table_name', conn) |
| To_JSON |
Writes DataFrame to a JSON formatted string |
df.to_json('file.json') |
| To_HTML |
Writes DataFrame to HTML tables |
df.to_html('file.html') |
| To_Clipboard |
Writes DataFrame to the clipboard |
df.to_clipboard() |
Create Test Objects
| Action |
Definition |
Example Code Snippet |
| Dataframe |
Constructs a DataFrame object |
df = pd.DataFrame(data) |
| Series |
Constructs a Series object |
s = pd.Series(data) |
| Index |
Constructs an Index object |
index = pd.Index(data) |
Working with DataFrames
DataFrame Basics
| Action |
Definition |
Example Code Snippet |
| Return Dimensions of a DataFrame |
Gets shape of DataFrame |
df.shape |
| Read CSV file into a DataFrame |
Reads CSV and returns DataFrame object |
df = pd.read_csv('file.csv') |
| Return the data type of each column |
Returns data types of columns in DataFrame |
df.dtypes |
Selecting DataFrame Values
| Action |
Definition |
Example Code Snippet |
| Select the rank column from f500 |
Selects a specific column from DataFrame |
f500['rank'] |
| Select the first 3 rows from f500 |
Slices the DataFrame |
f500.head(3) |
LOC
| Action |
Definition |
Example Code Snippet |
| LOC |
Access a group of rows and columns by labels |
df.loc[row_index, 'column_name'] |
ILOC
| Action |
Definition |
Example Code Snippet |
| ILOC |
Access a group of rows and columns by integer index |
df.iloc[row_index, col_index] |
Boolean Masks
| Action |
Definition |
Example Code Snippet |
| Boolean Masks |
Filters DataFrame based on a condition |
df[df['column'] > value] |
Boolean Operators
| Action |
Definition |
Example Code Snippet |
| Boolean Operators |
Combines multiple conditions for filtering |
df[(df['column'] > value) & (df['column'] < value2)] |
Graphs
| Action |
Definition |
Example Code Snippet |
| Generate a frequent table from a series object |
Counts unique values in Series |
series.value_counts() |
| Generate a sorted frequency table from series object |
Counts and sorts unique values |
series.value_counts().sort_values() |
| Generate a vertical bar plot from a series object |
Plots bar chart from Series |
series.plot.bar() |
| Generate a horizontal bar plot from a series object |
Plots horizontal bar chart from Series |
series.plot.barh() |
| Generate a line plot from a DataFrame object |
Plots line chart from DataFrame |
df.plot.line() |
| Generate a scatter plot from a DataFrame object |
Plots scatter chart |
df.plot.scatter(x='col1', y='col2') |
Data Cleaning
| Action |
Definition |
Example Code Snippet |
| Columns |
Access columns of DataFrame as attributes |
df.columns |
| Isnull |
Detects missing values |
df.isnull() |
| Notnull |
Detects non-missing values |
df.notnull() |
| Dropna |
Removes missing values |
df.dropna() |
| Fillna |
Fills missing values |
df.fillna(value) |
| Astype |
Converts data type of a DataFrame column |
df['col'] = df['col'].astype('int') |
| Replace |
Replaces values |
df.replace(to_replace, value) |
| Rename |
Renames DataFrame columns |
df.rename(columns={'old': 'new'}) |
| Set_index |
Sets DataFrame index |
df.set_index('col') |
| Finding correlation |
Computes pairwise correlation of columns |
df.corr() |
| Converting a column to datetime |
Converts column to datetime format |
df['date'] = pd.to_datetime(df['date']) |
Join and Combine
| Action |
Definition |
Example Code Snippet |
| Append |
Appends rows of other DataFrame to the end |
df.append(other_df) |
| Concat |
Concatenate pandas objects along a particular axis |
pd.concat([df1, df2]) |
| Join |
Joins columns of another DataFrame |
df.join(other_df) |
Statistics
| Action |
Definition |
Example Code Snippet |
| Describe |
Generates descriptive statistics |
df.describe() |
| Mean |
Computes mean of DataFrame |
df.mean() |
| Corr |
Computes pairwise correlation of columns |
df.corr() |
| Count |
Returns the number of non-NA/null observations |
df.count() |
| Max |
Returns the maximum of DataFrame values |
df.max() |
| Min |
Returns the minimum of DataFrame values |
df.min() |
| Median |
Computes the median of DataFrame columns |
df.median() |
| STD |
Computes the standard deviation of DataFrame columns |
df.std() |
This cheat sheet covers the essential functions and commands you'll need when working with Pandas in Python, providing quick references to keep your data analysis workflows smooth and productive.
More Python resources
If you're looking for additional Python resources, explore the following cheat sheets, glossary, and skills assessments:
Build your Pandas skills with Coursera
Pandas is an essential Python tool for professionals in all industries. Whether you have a computer coding background or are taking your first step into this field, completing a certificate or specialization on Coursera can help you build the technical skills needed to enter the expanding world of computers and software.
With Coursera Plus, you can learn and earn credentials at your own pace from over 170 leading companies and universities. With a monthly or annual subscription, you’ll gain access to over 10,000 programs—just check the course page to confirm your selection is included.


