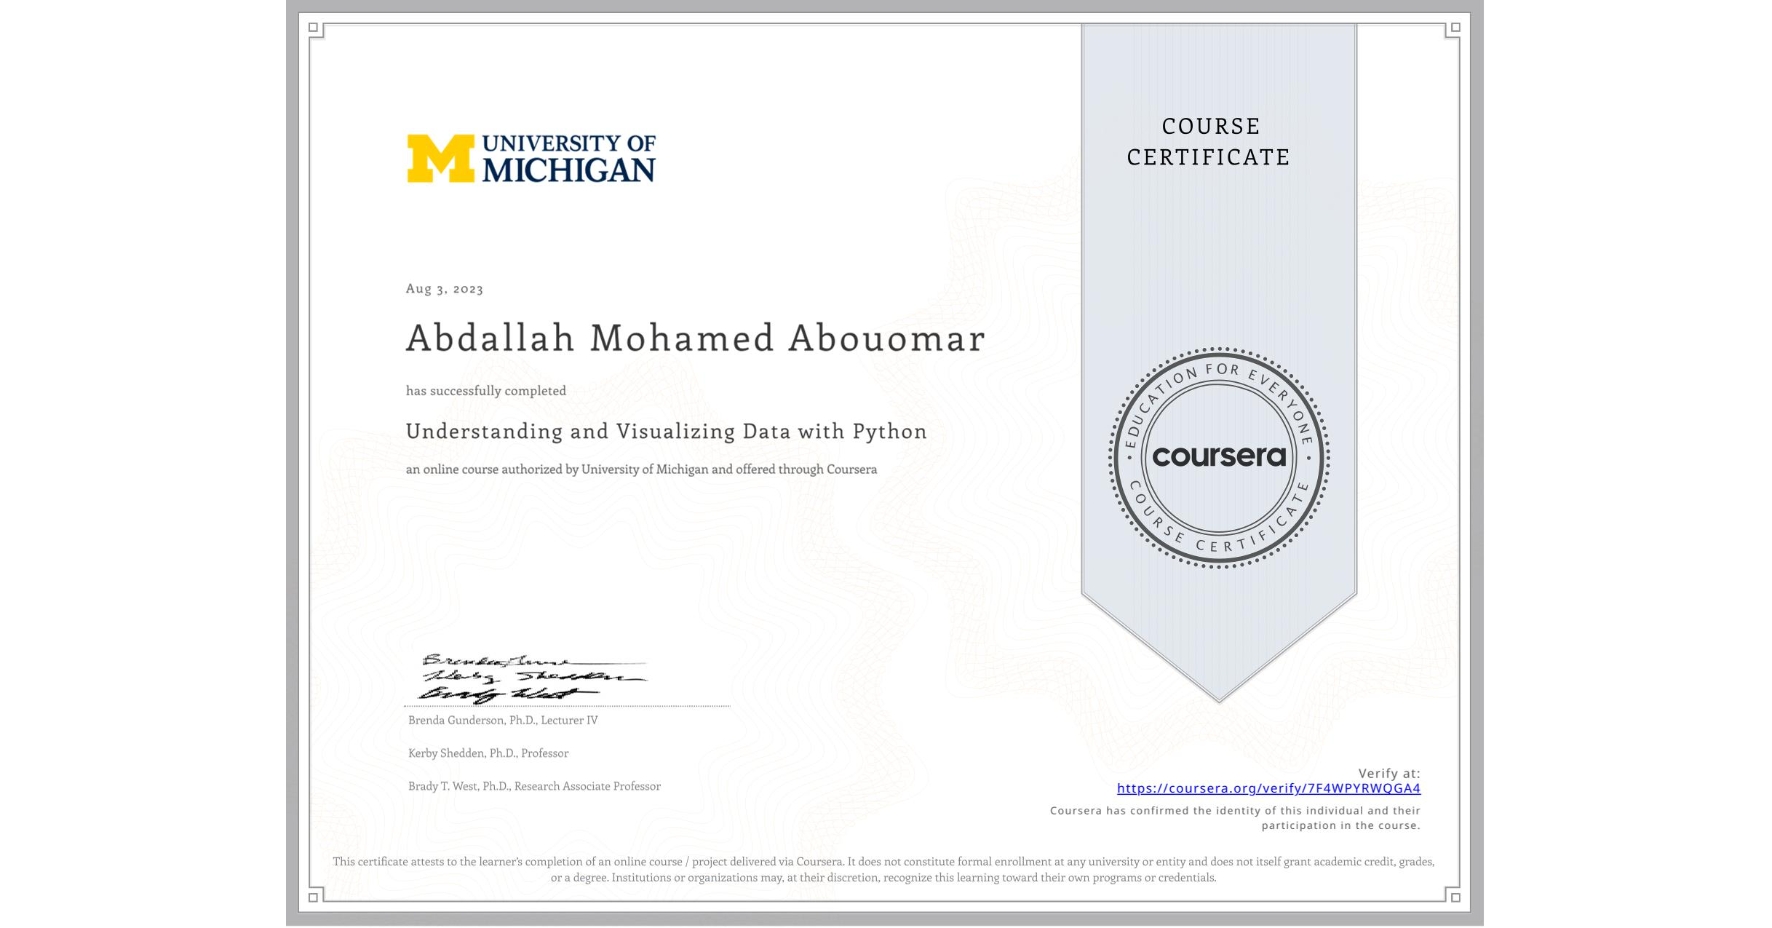
Understanding and Visualizing Data with Python
Completed by Abdallah Mohamed Abouomar
August 3, 2023
19 hours (approximately)
Abdallah Mohamed Abouomar's account is verified. Coursera certifies their successful completion of Understanding and Visualizing Data with Python

What you will learn
Properly identify various data types and understand the different uses for each
Create data visualizations and numerical summaries with Python
Communicate statistical ideas clearly and concisely to a broad audience
Identify appropriate analytic techniques for probability and non-probability samples
Skills you will gain
- Category: Descriptive Statistics
- Category: Exploratory Data Analysis
- Category: Statistical Inference
- Category: Statistical Visualization
- Category: Matplotlib
- Category: Sampling (Statistics)
- Category: Statistical Programming
- Category: Statistics
- Category: Data Analysis
- Category: NumPy
- Category: Data Visualization
- Category: Statistical Analysis