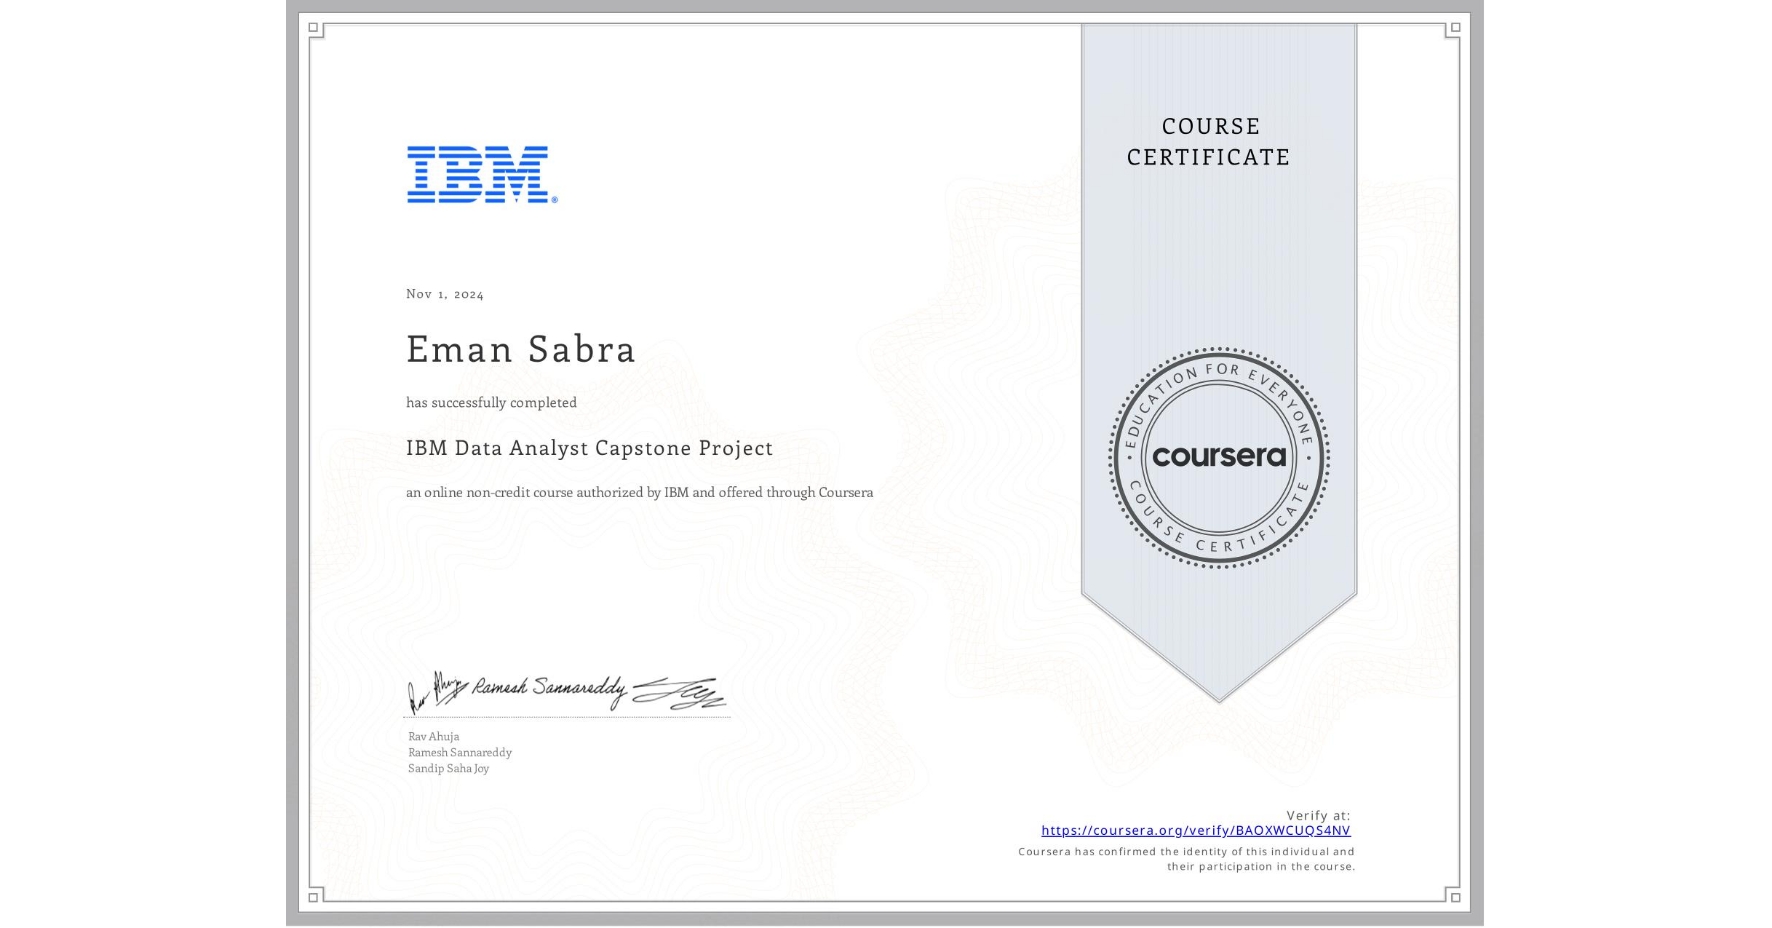
IBM Data Analyst Capstone Project
Completed by Eman Sabra
October 31, 2024
26 hours (approximately)
Eman Sabra's account is verified. Coursera certifies their successful completion of IBM Data Analyst Capstone Project

What you will learn
Apply techniques to gather and wrangle data from multiple sources.
Analyze data to identify patterns, trends, and insights through exploratory techniques.
Create visual representations of data using Python libraries to communicate findings effectively.
Construct interactive dashboards with BI tools to present and explore data dynamically.
Skills you will gain
- Category: Statistical Reporting
- Category: Scatter Plots
- Category: Data Visualization Software
- Category: Interactive Data Visualization
- Category: Statistical Visualization
- Category: Dashboard Creation
- Category: Box Plots
- Category: Scientific Visualization
- Category: IBM Cognos Analytics
- Category: Dashboard
- Category: Data Analysis
- Category: Data Storytelling