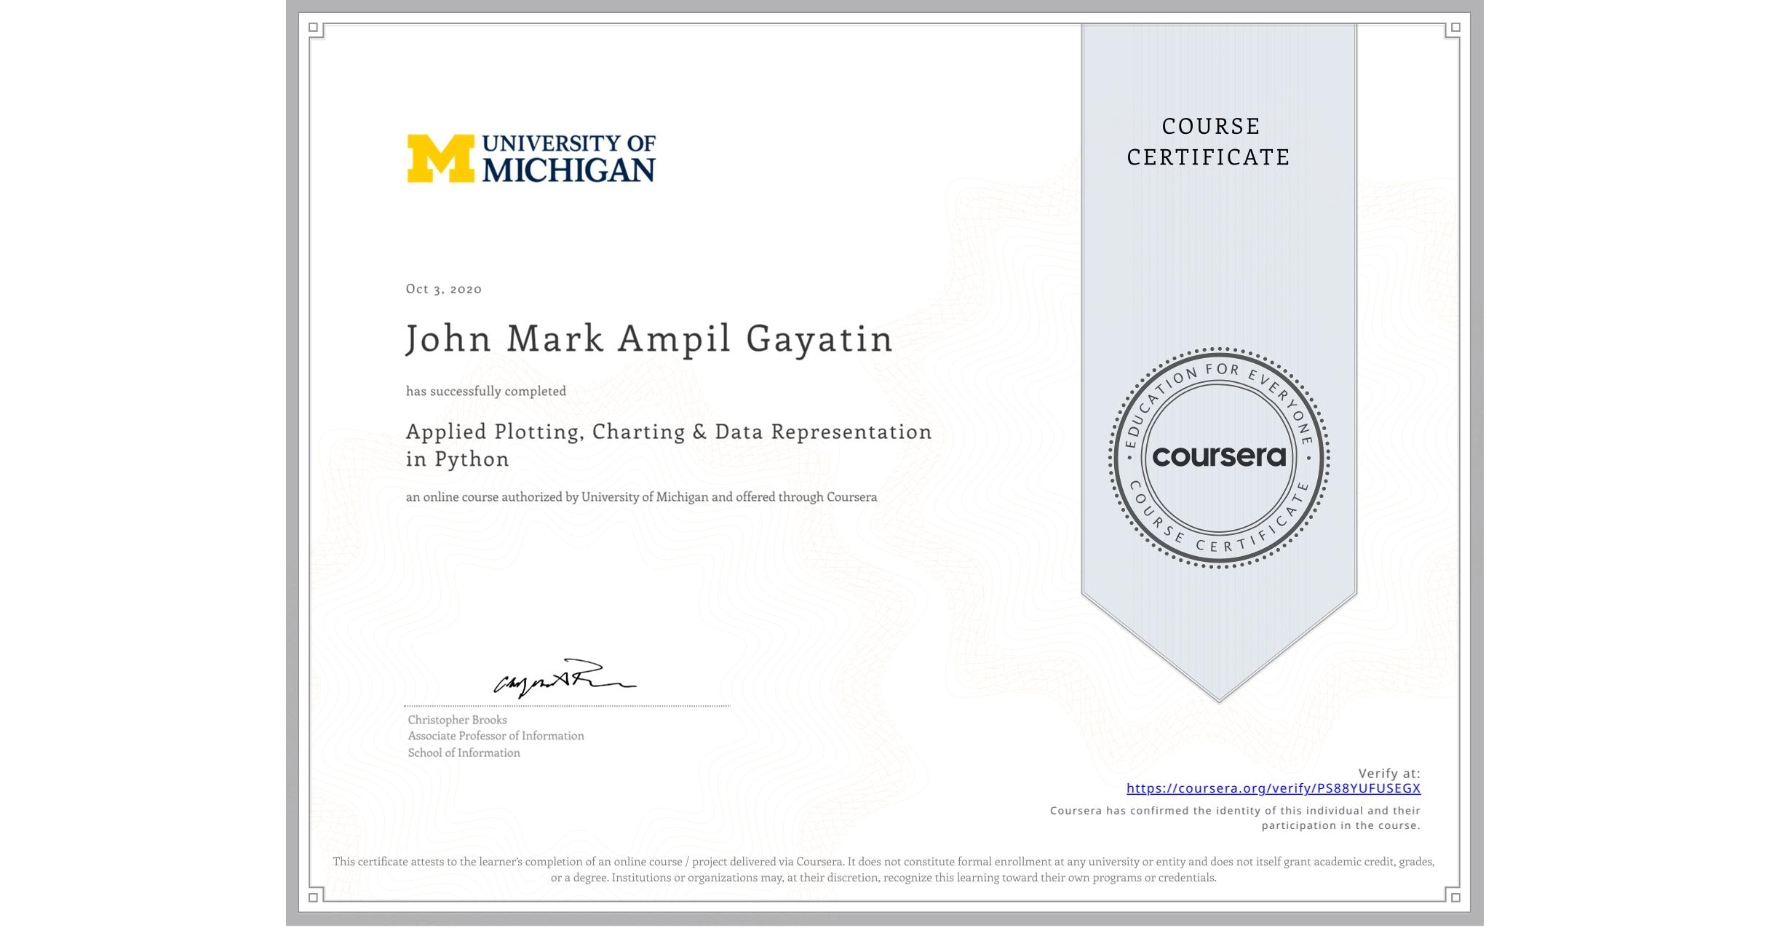
Applied Plotting, Charting & Data Representation in Python
Completed by John Mark Ampil Gayatin
October 3, 2020
24 hours (approximately)
John Mark Ampil Gayatin's account is verified. Coursera certifies their successful completion of Applied Plotting, Charting & Data Representation in Python

What you will learn
Describe what makes a good or bad visualization
Understand best practices for creating basic charts
Identify the functions that are best for particular problems
Create a visualization using matplotlb
Skills you will gain
- Category: Data Literacy
- Category: Data Visualization
- Category: Data Manipulation
- Category: Graphic and Visual Design
- Category: Graphing
- Category: Plot (Graphics)
- Category: Data Presentation
- Category: Interactive Data Visualization
- Category: Matplotlib
- Category: Data Visualization Software
- Category: Statistical Visualization
- Category: Python Programming