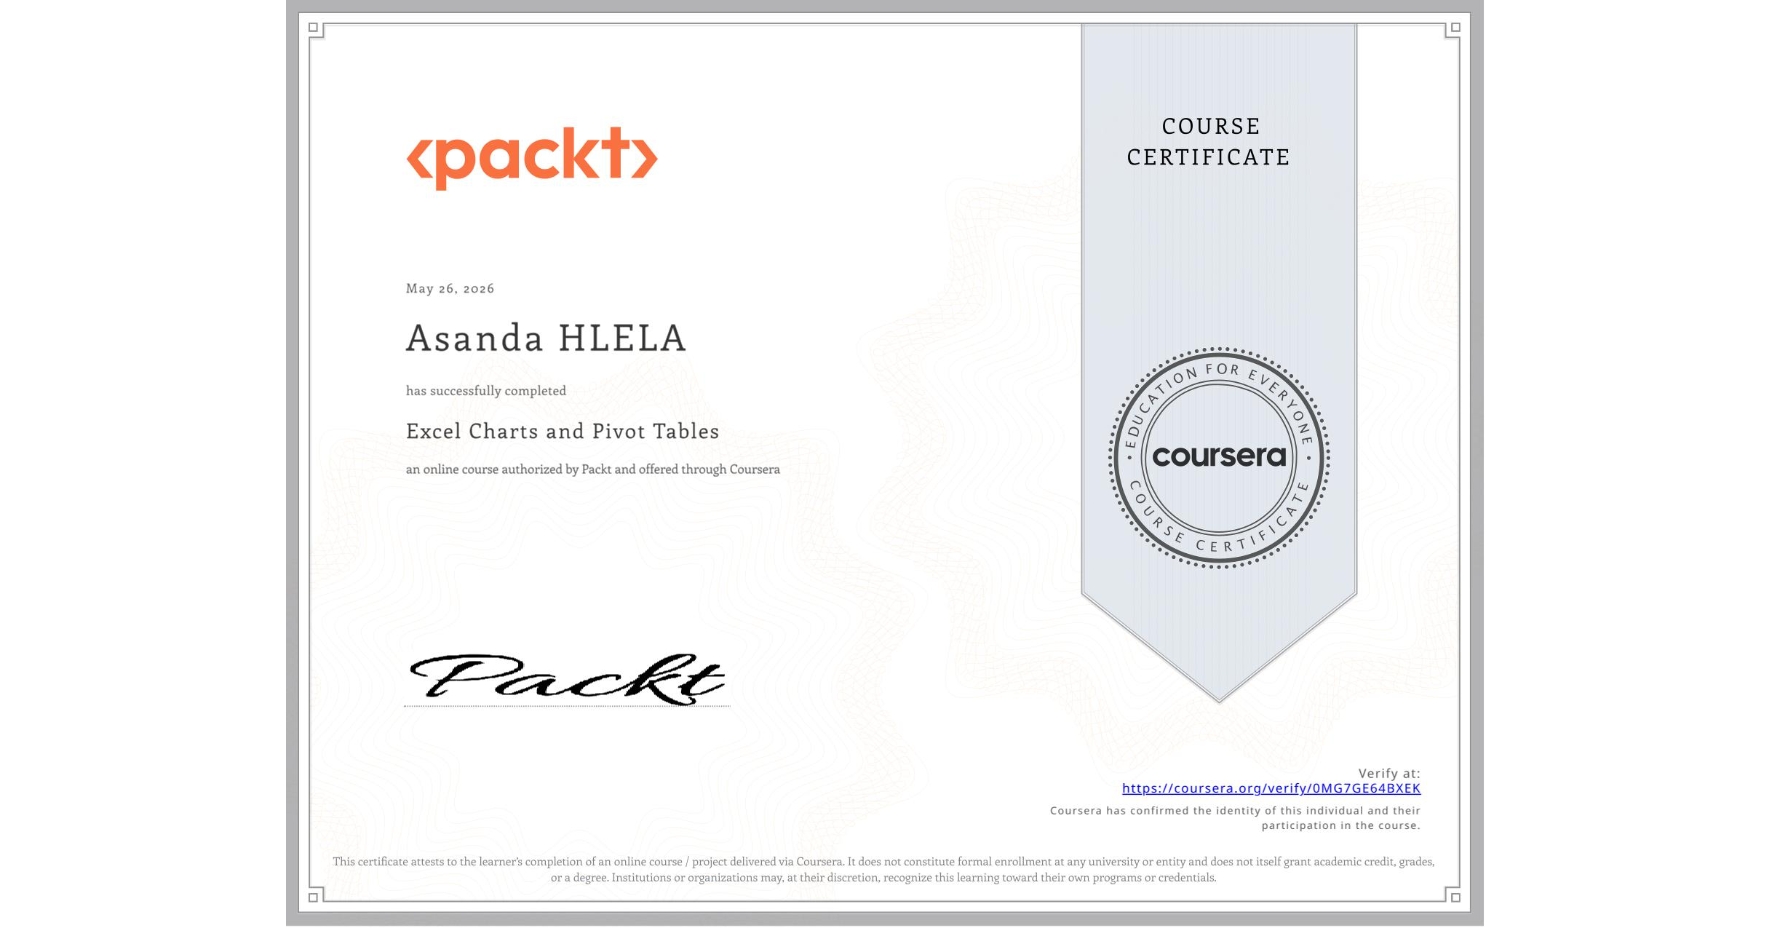
Excel Charts and Pivot Tables
Completed by Asanda HLELA
May 26, 2026
2 hours (approximately)
Asanda HLELA's account is verified. Coursera certifies their successful completion of Excel Charts and Pivot Tables

What you will learn
Learn how to create and customize various types of charts in Excel to represent data effectively.
Master pivot tables to analyze and summarize large datasets for deeper insights.
Develop skills in creating advanced data visualizations like combination charts and gauge charts.
Understand how to add trendlines, error bars, and sparklines to enhance your Excel charts.
Skills you will gain
- Category: Data Visualization
- Category: Data Storytelling