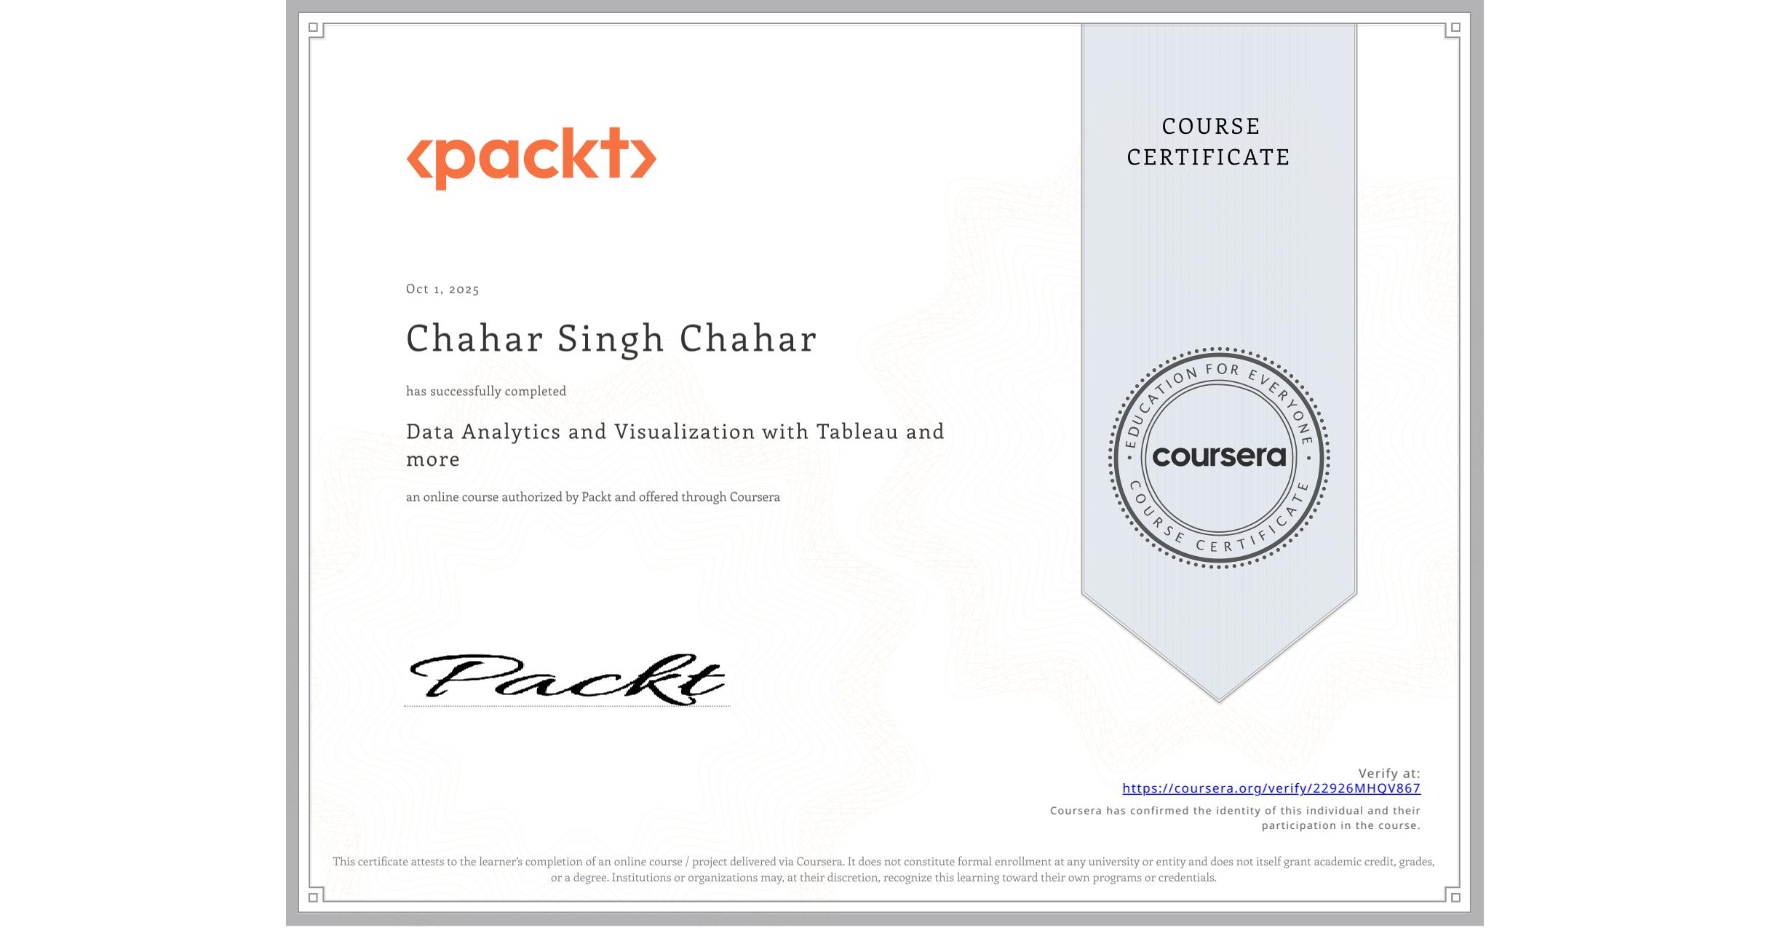
Data Analytics and Visualization with Tableau and more
Completed by Chahar Singh Chahar
October 1, 2025
27 hours (approximately)
Chahar Singh Chahar's account is verified. Coursera certifies their successful completion of Data Analytics and Visualization with Tableau and more

What you will learn
Automate workflows and manipulate datasets using Alteryx Designer
Build dynamic dashboards and analyze data with Tableau and Qlik Sense
Develop statistical models and perform advanced analyses using R
Create compelling visual stories and publish data insights effectively
Skills you will gain
- Category: Data Import/Export
- Category: Interactive Data Visualization
- Category: R Programming
- Category: Statistical Analysis
- Category: Data Visualization Software
- Category: Alteryx
- Category: Data Cleansing
- Category: Dashboard
- Category: Data Analysis
- Category: Data Processing
- Category: Data Manipulation
- Category: Tableau Software