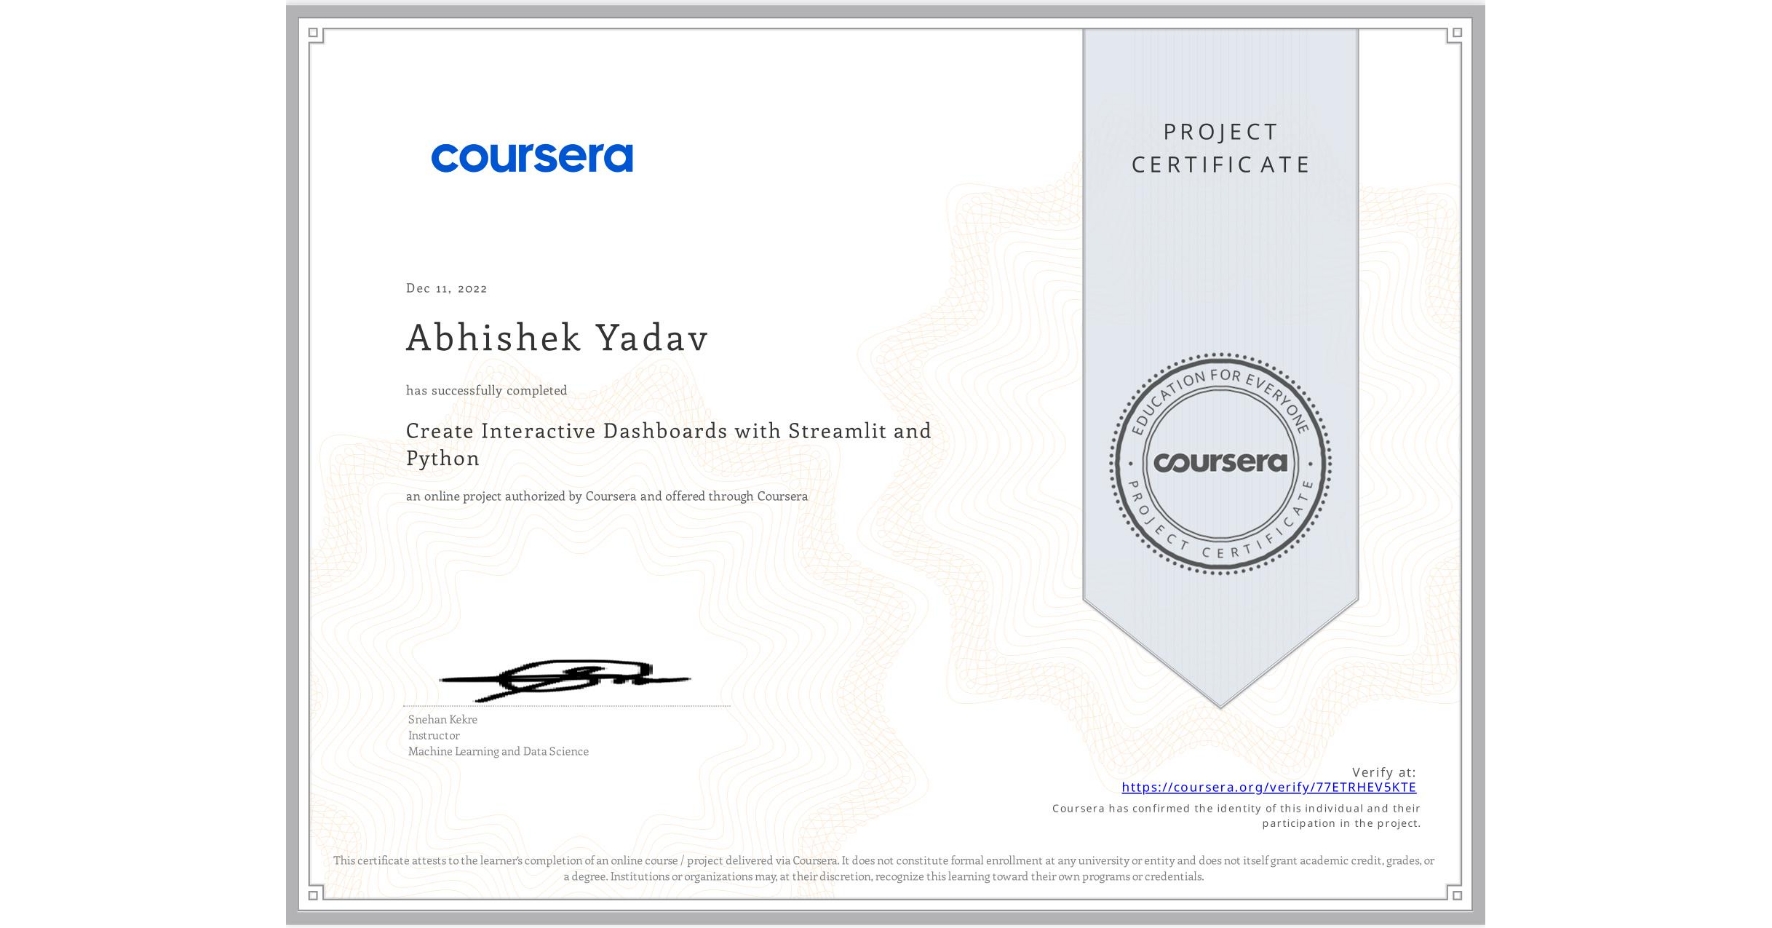
Create Interactive Dashboards with Streamlit and Python
Completed by Abhishek Yadav
December 11, 2022
2 hours (approximately)
Abhishek Yadav's account is verified. Coursera certifies their successful completion of Create Interactive Dashboards with Streamlit and Python

What you will learn
Build interactive data dashboards with Streamlit and Python
Use Pandas for data manipulation in data science workflows
Create interactive plots with Plotly Python
Skills you will gain
- Category: Data Manipulation
- Category: Data Science
- Category: Python Programming
- Category: Pandas (Python Package)
- Category: Plotly
- Category: Dashboard Creation
- Category: Plot (Graphics)
- Category: Data Visualization
- Category: Dashboard
- Category: Interactive Data Visualization
- Category: Application Development
- Category: Web Applications