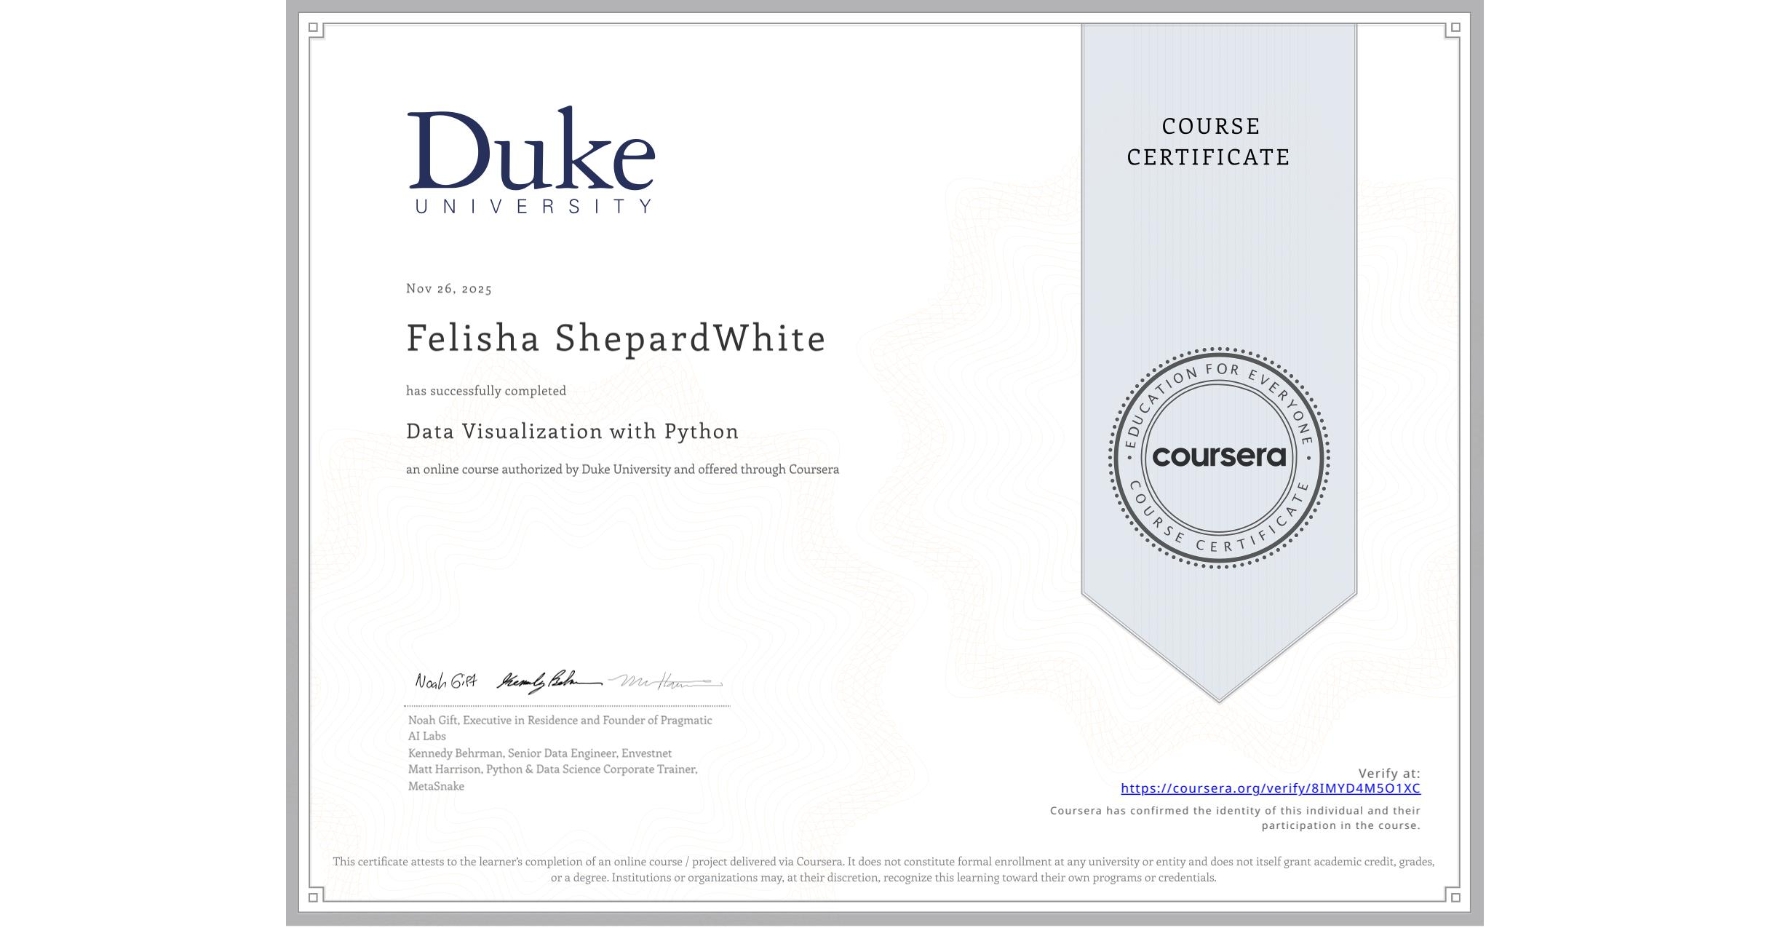
Data Visualization with Python
Completed by Felisha ShepardWhite
November 26, 2025
9 hours (approximately)
Felisha ShepardWhite's account is verified. Coursera certifies their successful completion of Data Visualization with Python

What you will learn
Apply Python, spreadsheets, and BI tooling proficiently to create visually compelling and interactive data visualizations.
Formulate and communicate data-driven insights and narratives through impactful visualizations and data storytelling.
Assess and select the most suitable visualization tools and techniques to address organizational data needs and objectives.
Skills you will gain
- Category: Data Storytelling
- Category: Plotly
- Category: Data Visualization
- Category: Plot (Graphics)
- Category: Seaborn
- Category: Cloud Applications
- Category: Matplotlib
- Category: Google Sheets
- Category: Scatter Plots
- Category: Tableau Software
- Category: Dashboard Creation
- Category: Interactive Data Visualization