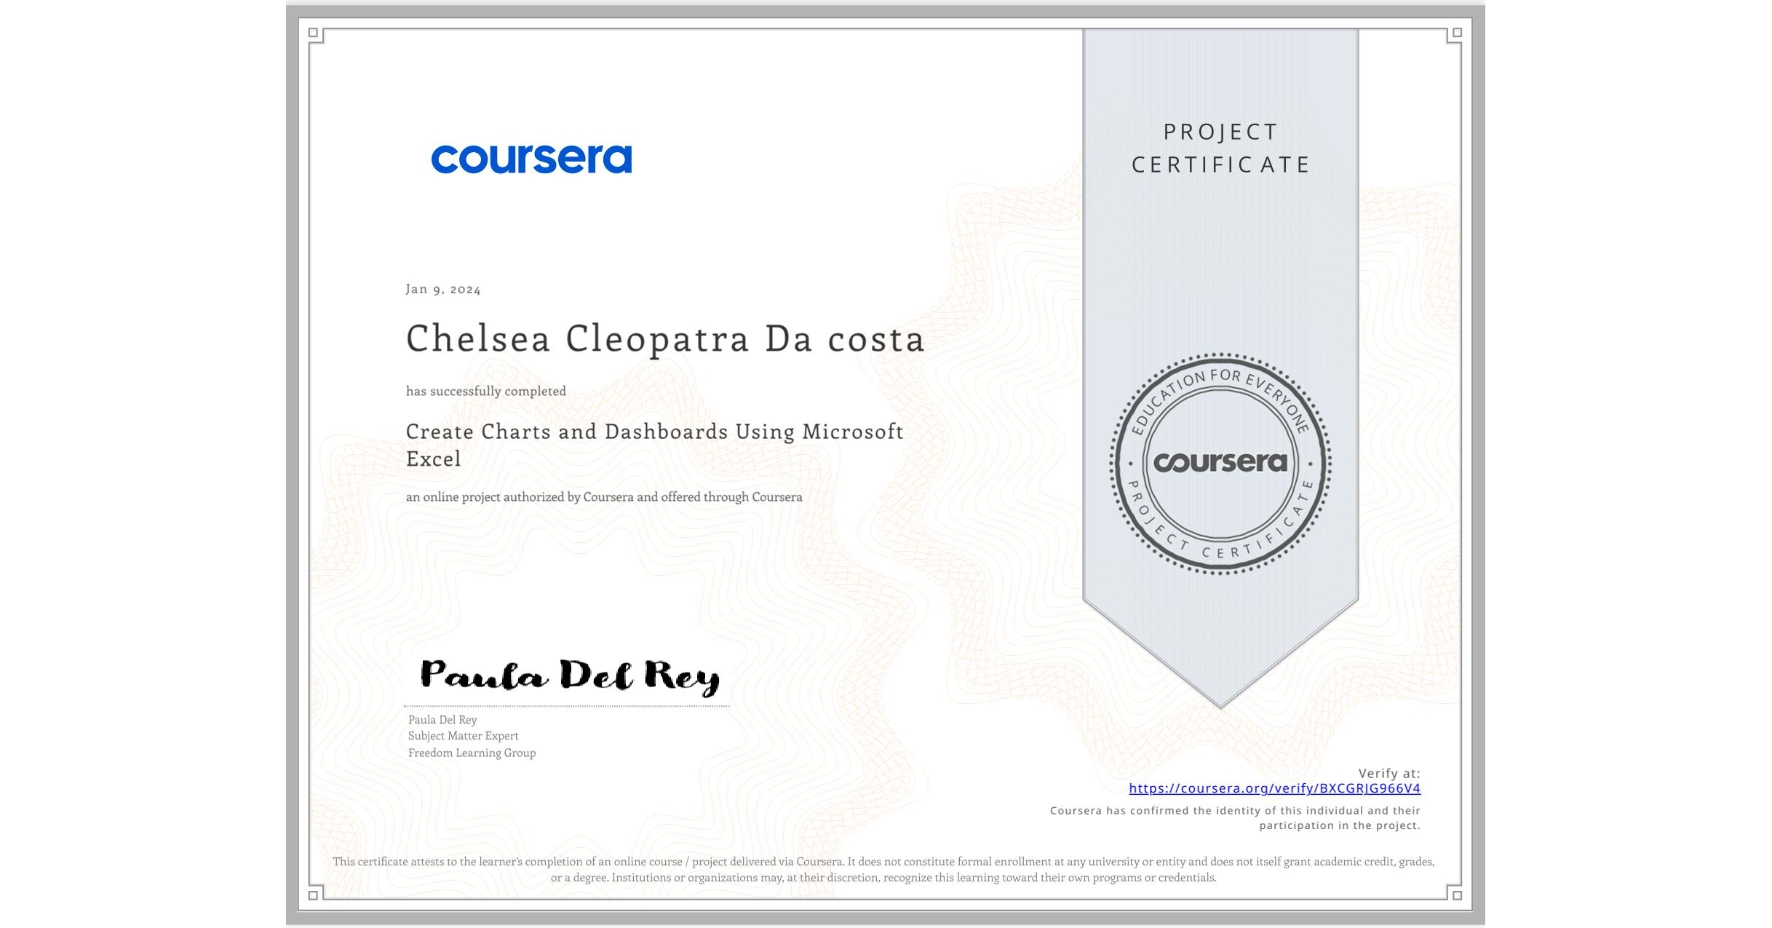
Create Charts and Dashboards Using Microsoft Excel
Completed by Chelsea Cleopatra Da costa
January 9, 2024
1 hours (approximately)
Chelsea Cleopatra Da costa's account is verified. Coursera certifies their successful completion of Create Charts and Dashboards Using Microsoft Excel

What you will learn
Create PivotTables to assess specific relationships within the data.
Create line, bar, and pie charts to present the information from the PivotTables.
Compose a dashboard with the charts and tables created to present a global picture of the data.
Skills you will gain
- Category: Dashboard
- Category: Data Analysis
- Category: Microsoft Excel
- Category: Data Visualization
- Category: Microsoft 365
- Category: Document Management
- Category: Trend Analysis
- Category: Microsoft Office