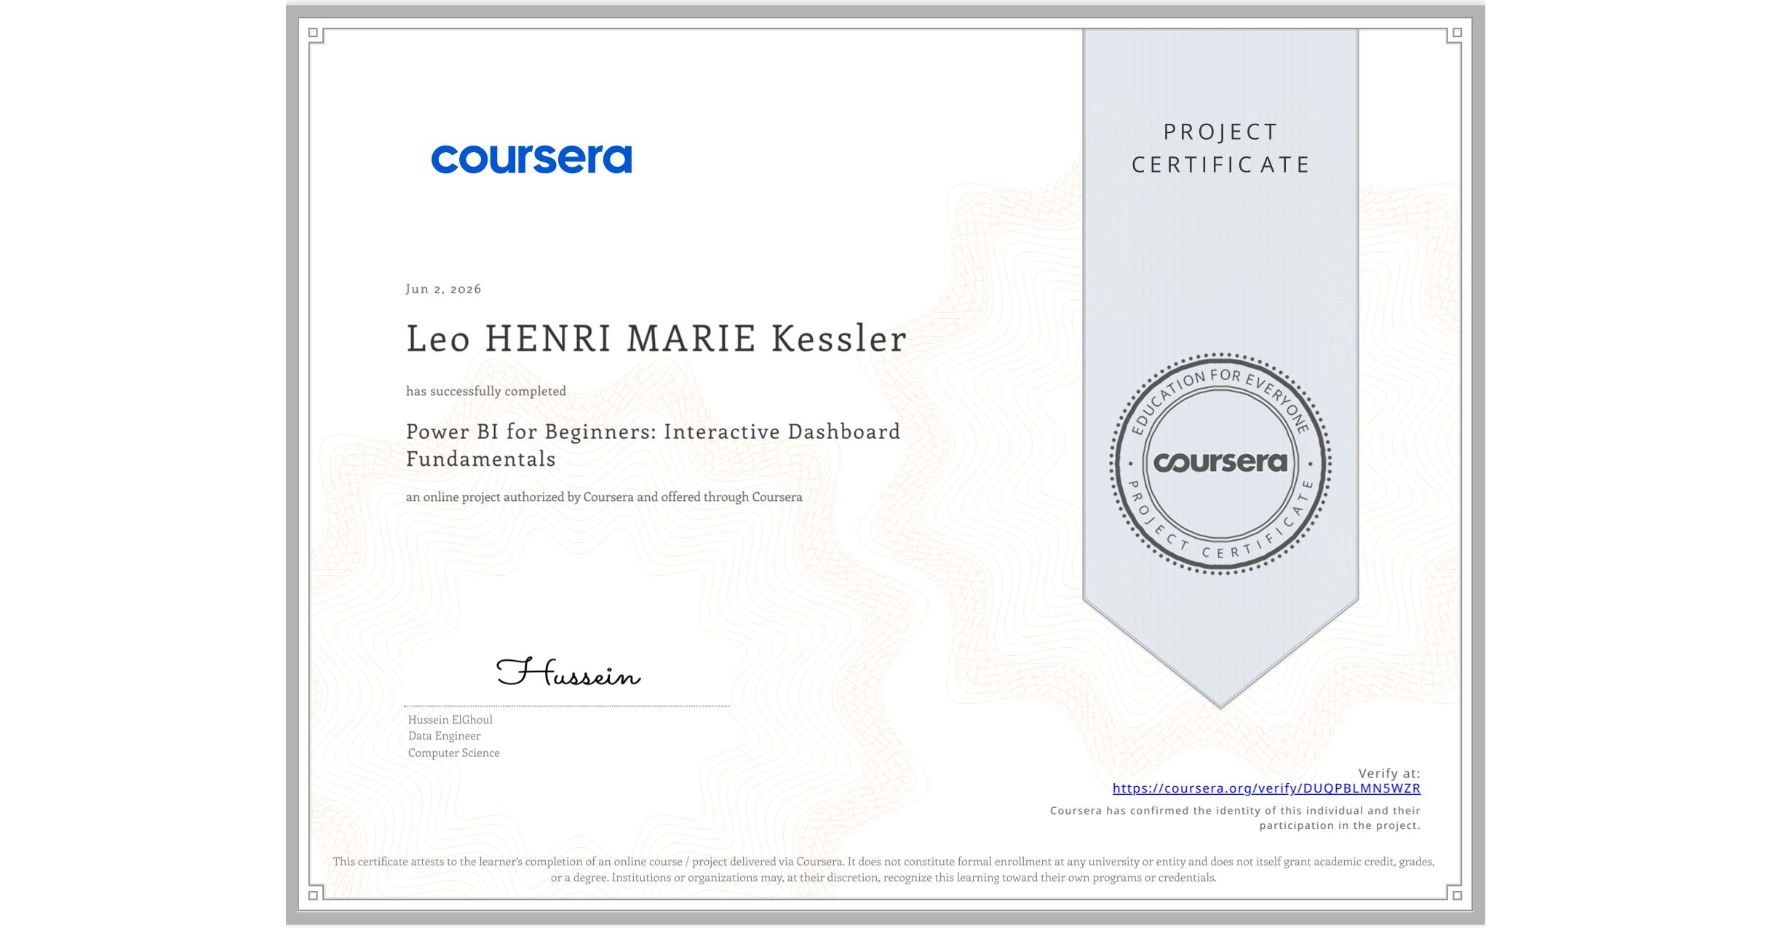
Power BI for Beginners: Interactive Dashboard Fundamentals
Completed by Leo HENRI MARIE Kessler
June 2, 2026
2 hours (approximately)
Leo HENRI MARIE Kessler's account is verified. Coursera certifies their successful completion of Power BI for Beginners: Interactive Dashboard Fundamentals

What you will learn
Import, analyze data, and define key performance indicators (KPIs) for dashboard tracking
Apply visualization best practices by matching chart types to specific data insights
Design an interactive dashboard that integrates multiple visualizations to tell a cohesive story
Skills you will gain
- Category: Dashboard Creation
- Category: Performance Analysis
- Category: Power BI
- Category: Data Storytelling
- Category: Business Metrics
- Category: Business Reporting
- Category: Data Visualization Software
- Category: Data Presentation
- Category: Dashboard
- Category: Data Visualization
- Category: Trend Analysis
- Category: Data Import/Export