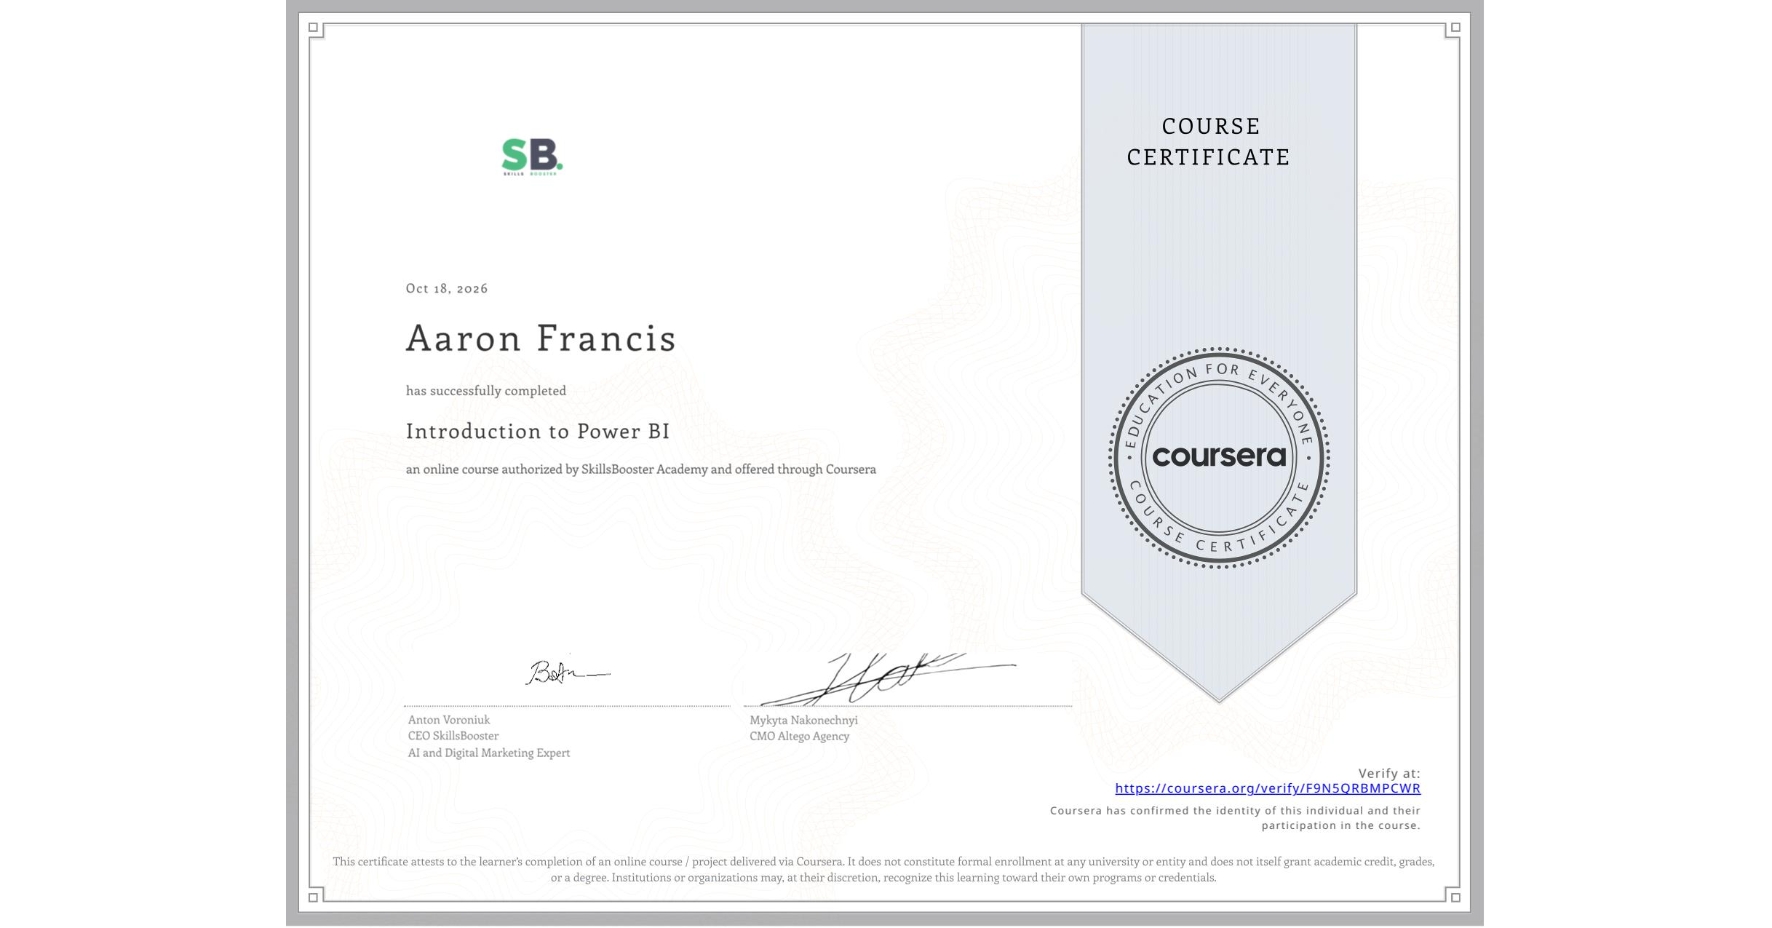
Introduction to Power BI
Completed by Aaron Francis
October 18, 2026
5 hours (approximately)
Aaron Francis's account is verified. Coursera certifies their successful completion of Introduction to Power BI

What you will learn
Connect Power BI to Excel and other sources, then clean, reshape and combine raw data into a reliable model using Power Query and table relationships
Build KPI visuals, combo charts, project timelines and branded report pages, and write DAX calculations for figures your source data does not contain
Judge what your data actually supports — separating real trends from noise, spotting misleading charts, and choosing colours every reader can read
Skills you will gain
- Category: Data Analysis Software
- Category: Power BI
- Category: Dashboard
- Category: Spreadsheet Software
- Category: Business Reporting
- Category: Dashboard Creation
- Category: Key Performance Indicators (KPIs)
- Category: Timelines
- Category: Data Analysis
- Category: Microsoft Excel
- Category: Analytical Skills
- Category: Data Transformation