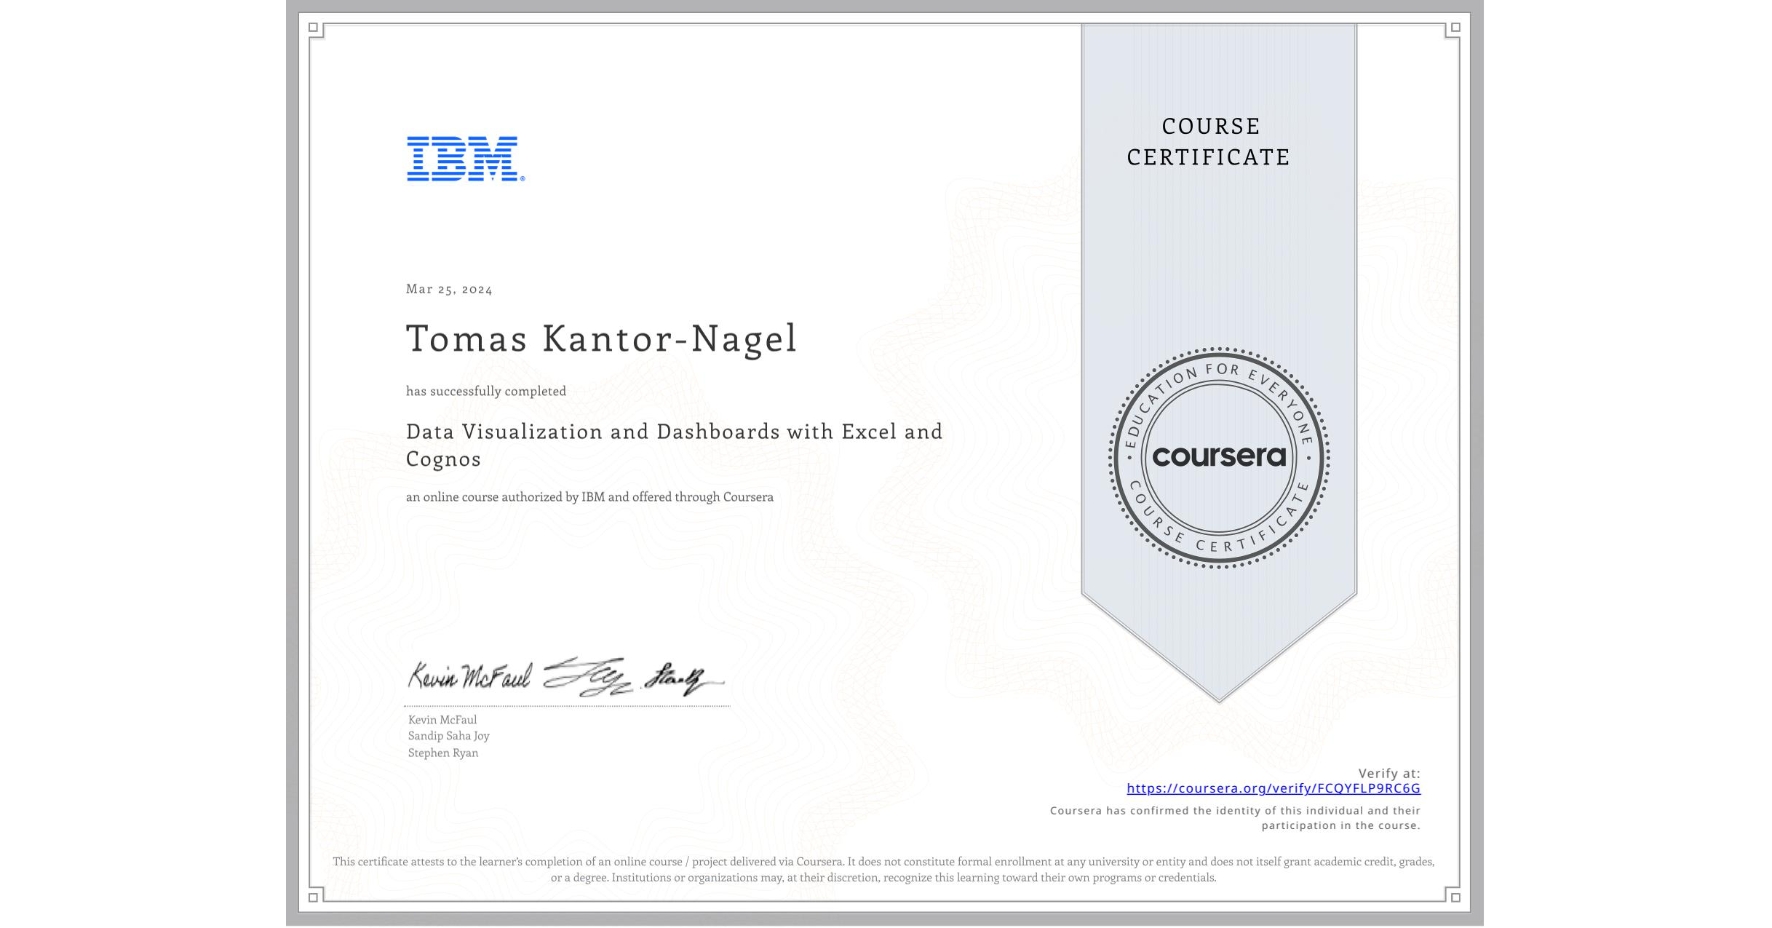
Data Visualization and Dashboards with Excel and Cognos
Completed by Tomas Kantor-Nagel
March 25, 2024
15 hours (approximately)
Tomas Kantor-Nagel's account is verified. Coursera certifies their successful completion of Data Visualization and Dashboards with Excel and Cognos

What you will learn
Create basic visualizations such as line graphs, bar graphs, and pie charts using Excel spreadsheets.
Explain the important role charts play in telling a data-driven story.
Construct advanced charts and visualizations such as Treemaps, Sparklines, Histogram, Scatter Plots, and Filled Map Charts.
Build and share interactive dashboards using Excel and Cognos Analytics.
Skills you will gain
- Category: IBM Cognos Analytics
- Category: Histogram
- Category: Dashboard Creation
- Category: Data Presentation
- Category: Data Visualization Software
- Category: Data Analysis
- Category: Microsoft Excel
- Category: Interactive Data Visualization
- Category: Business Intelligence Software
- Category: Pivot Tables And Charts
- Category: Dashboard
- Category: Plot (Graphics)