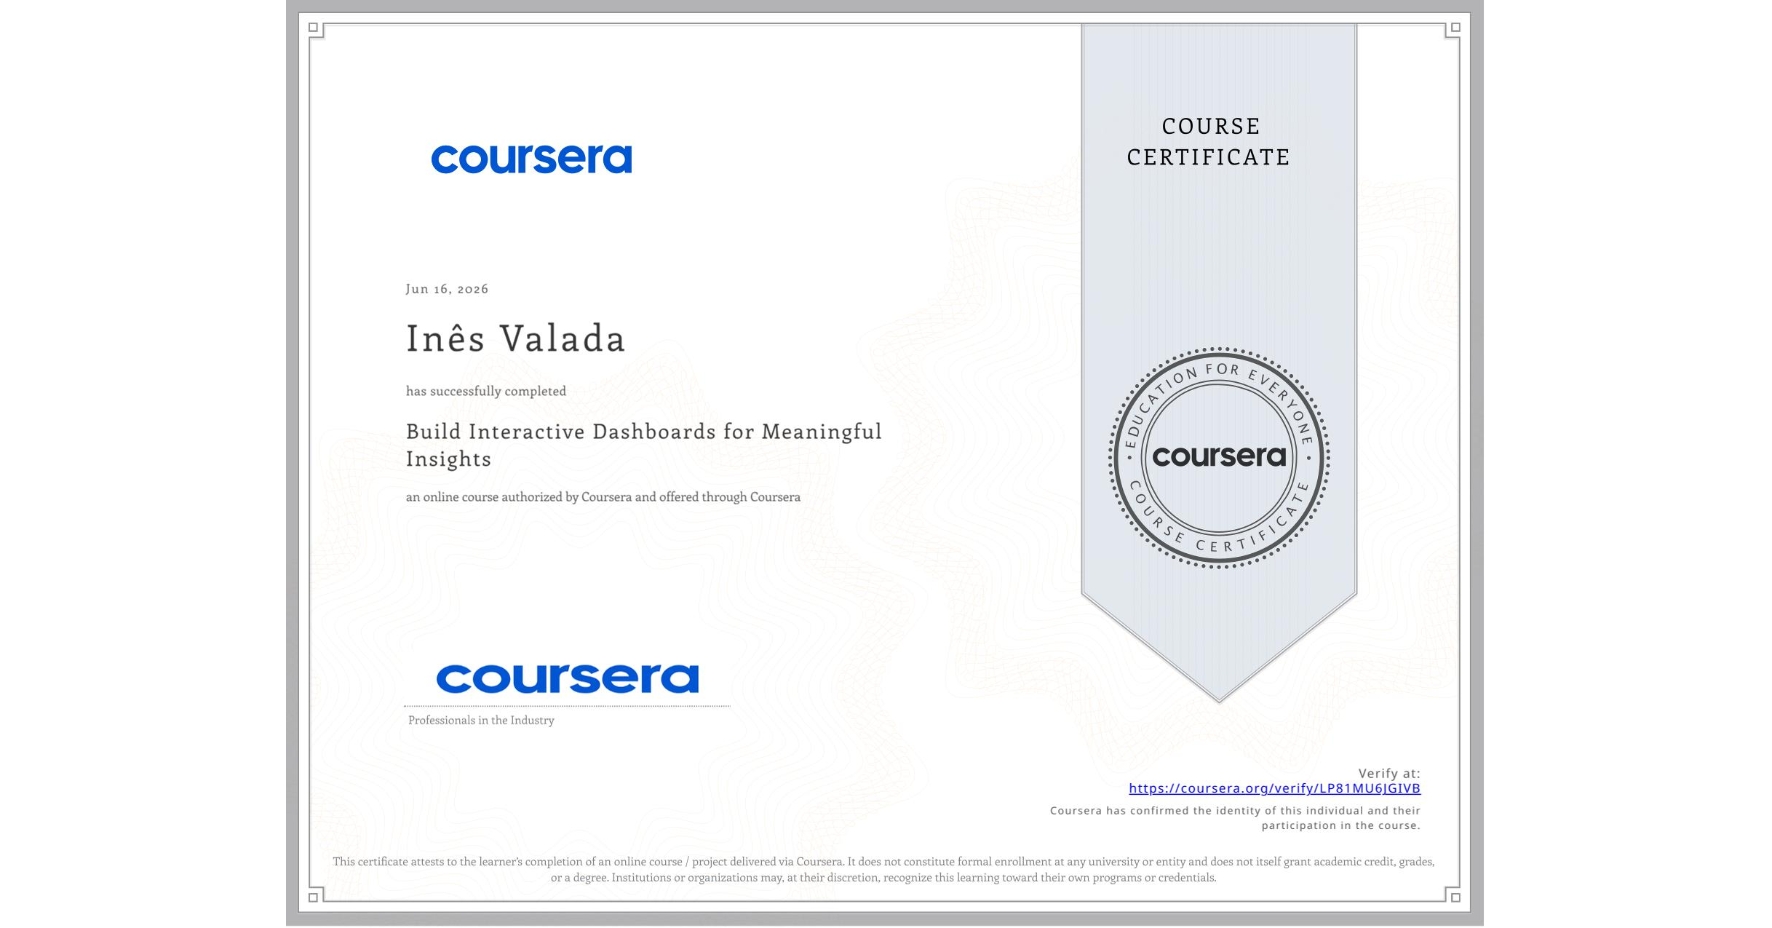
Build Interactive Dashboards for Meaningful Insights
Completed by Inês Valada
June 16, 2026
1 hours (approximately)
Inês Valada's account is verified. Coursera certifies their successful completion of Build Interactive Dashboards for Meaningful Insights

What you will learn
Effective dashboards start by understanding stakeholder questions and the analytical workflows they rely on for decisions.
Self-service dashboards balance powerful features with intuitive design, enabling exploration without user overload.
Drill-through interactions turn static reports into dynamic tools, guiding users from summaries to detailed insights.
Successful dashboards combine technical skill with empathetic design to connect business needs and capabilities.
Skills you will gain
- Category: Business Requirements
- Category: Conversion Funnel Analysis
- Category: Dashboard Creation
- Category: Data Storytelling
- Category: Dashboard
- Category: Requirements Analysis
- Category: Requirements Elicitation
- Category: Key Performance Indicators (KPIs)
- Category: Interactive Data Visualization
- Category: Functional Specification
- Category: Self Service Technologies