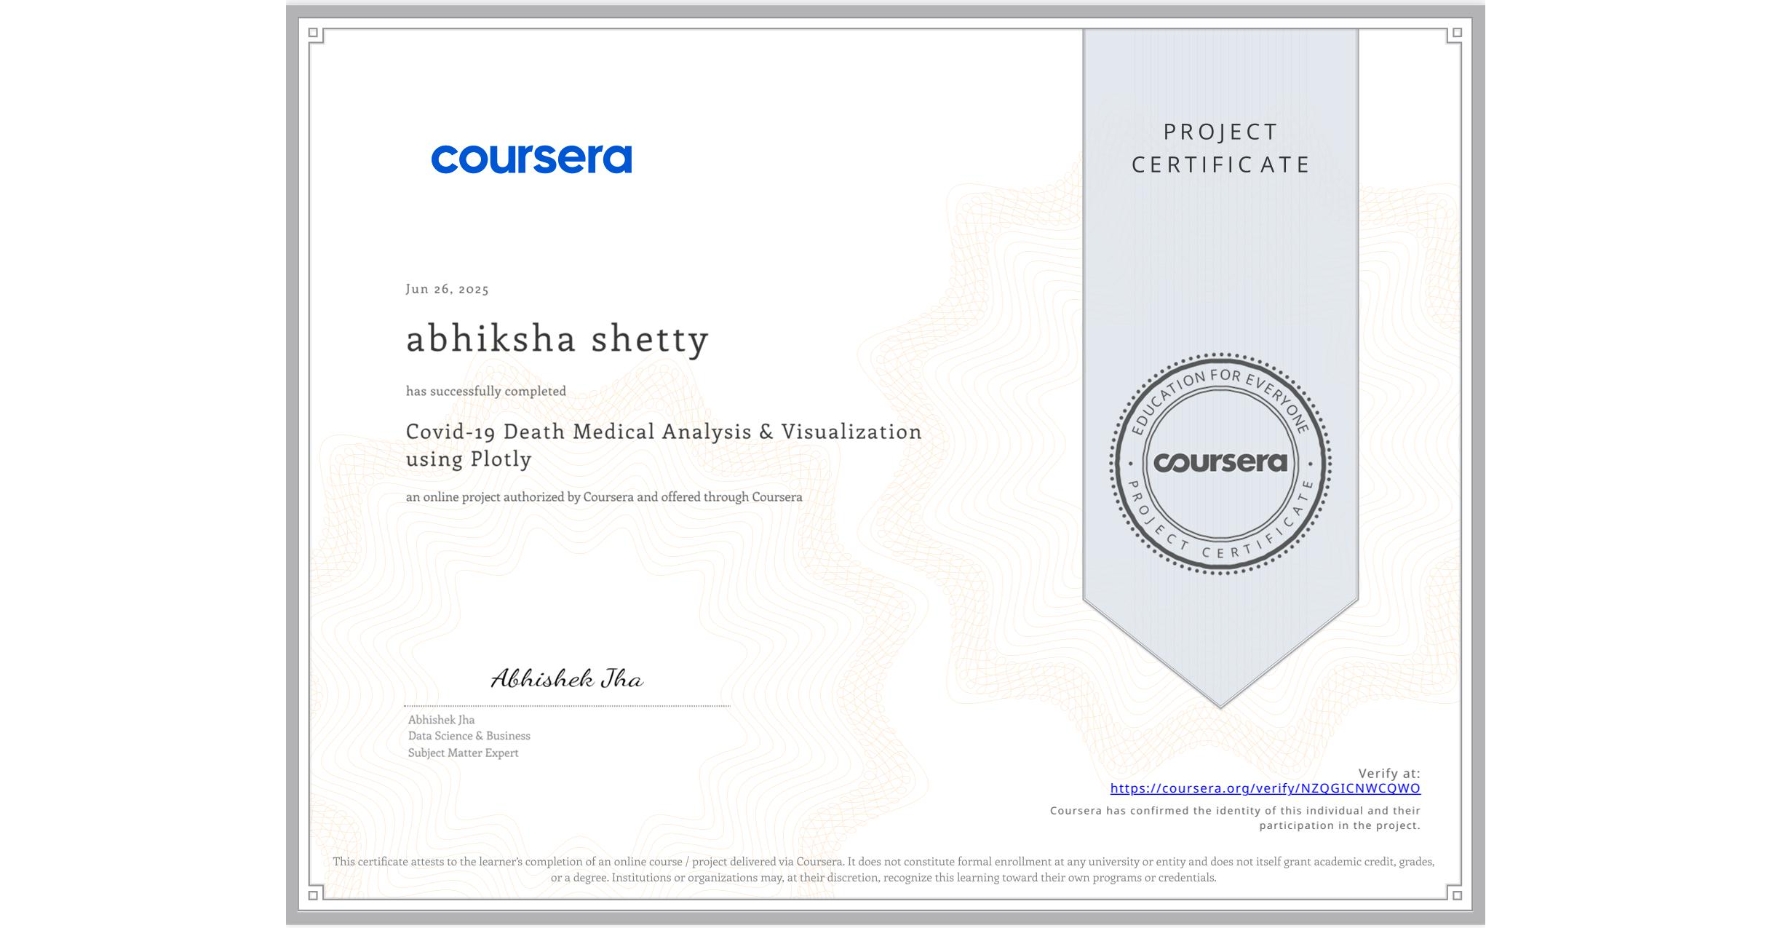
Covid-19 Death Medical Analysis & Visualization using Plotly
Completed by abhiksha shetty
June 26, 2025
2 hours (approximately)
abhiksha shetty's account is verified. Coursera certifies their successful completion of Covid-19 Death Medical Analysis & Visualization using Plotly

What you will learn
Analyze and Visualize the current global scenario of Covid-19 using bar graphs, scatter plots and choropleth maps in Plotly express
Analyze and visualize various medical conditions contributing to death due to Covid using Plotly express and Wordcloud text visualization
Skills you will gain
- Category: Analysis
- Category: Data Import/Export
- Category: Datamaps
- Category: Medical Science and Research
- Category: Data Visualization
- Category: Scatter Plots
- Category: Plotly
- Category: Data Visualization Software
- Category: Python Programming
- Category: Data Analysis
- Category: Plot (Graphics)