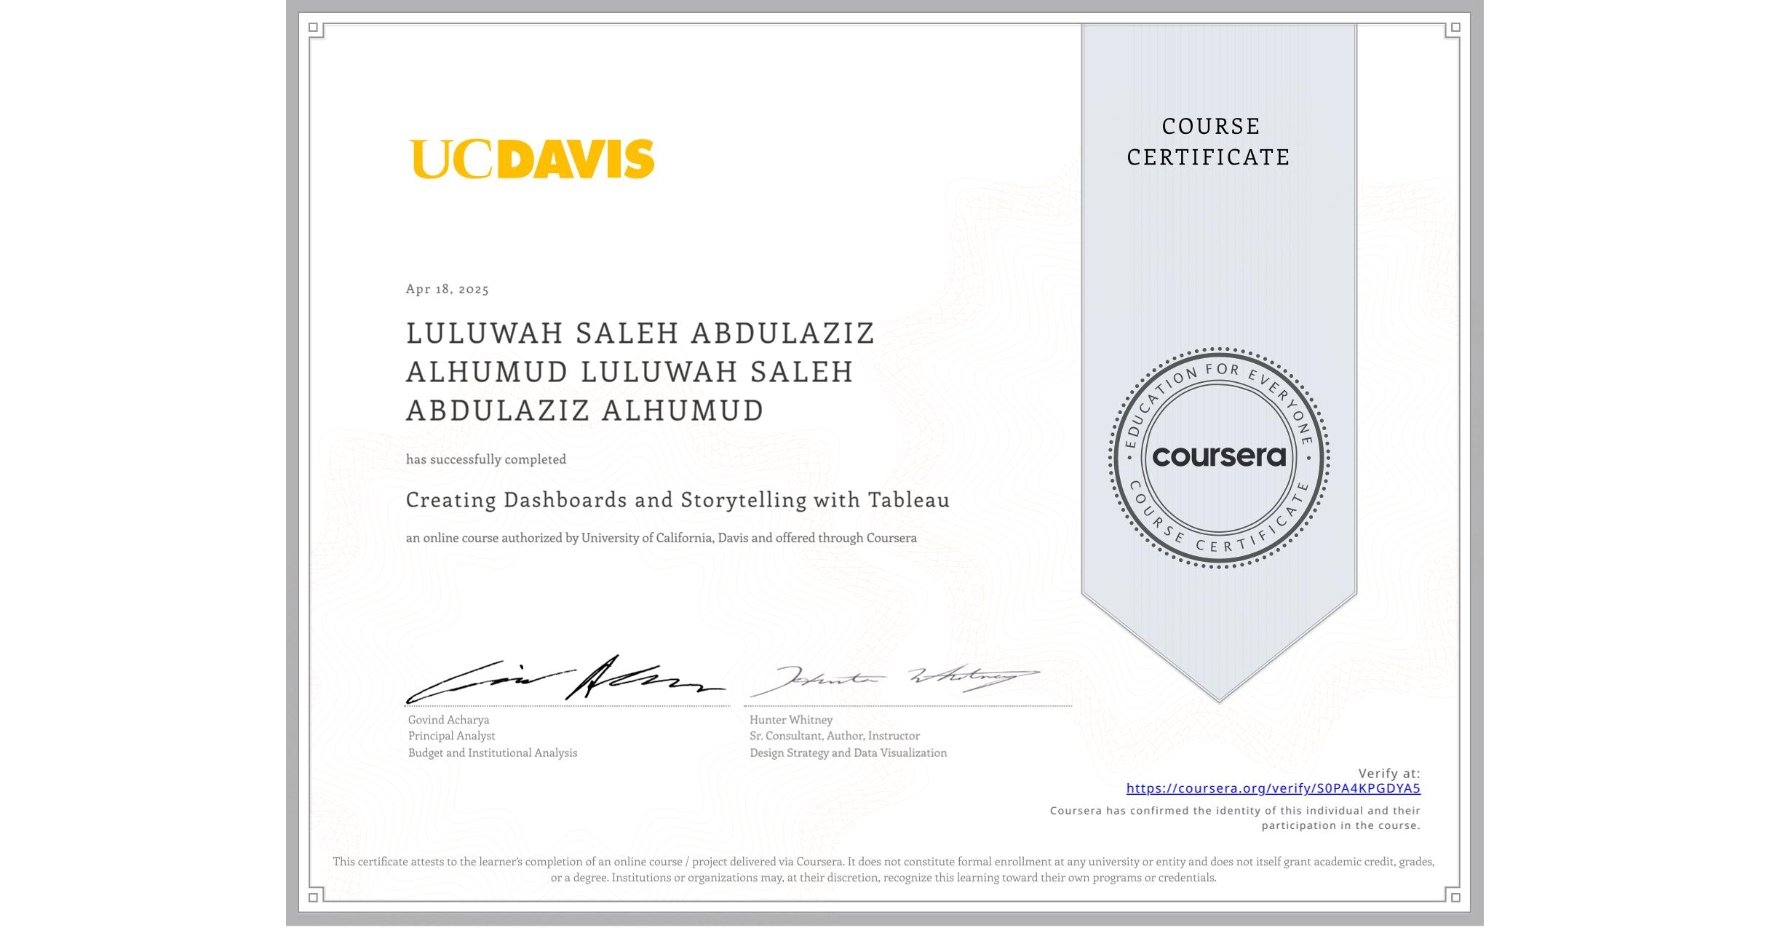
Creating Dashboards and Storytelling with Tableau
Completed by LULUWAH SALEH ABDULAZIZ ALHUMUD LULUWAH SALEH ABDULAZIZ ALHUMUD
April 18, 2025
8 hours (approximately)
LULUWAH SALEH ABDULAZIZ ALHUMUD LULUWAH SALEH ABDULAZIZ ALHUMUD's account is verified. Coursera certifies their successful completion of Creating Dashboards and Storytelling with Tableau

What you will learn
Combine the data and follow the best practices to present your story
Create calculated fields for KPIs to build a figure that will be used to measure progress in the data
Assemble a dashboard
Analyze concepts and techniques for compelling storytelling with data
Skills you will gain
- Category: Interactive Data Visualization
- Category: Dashboard
- Category: Data Preprocessing
- Category: Data Cleansing
- Category: Tableau Software
- Category: Data Quality
- Category: Dashboard Creation
- Category: Storyboarding
- Category: Data Storytelling
- Category: Stakeholder Analysis
- Category: Data Visualization Software
- Category: Data Visualization