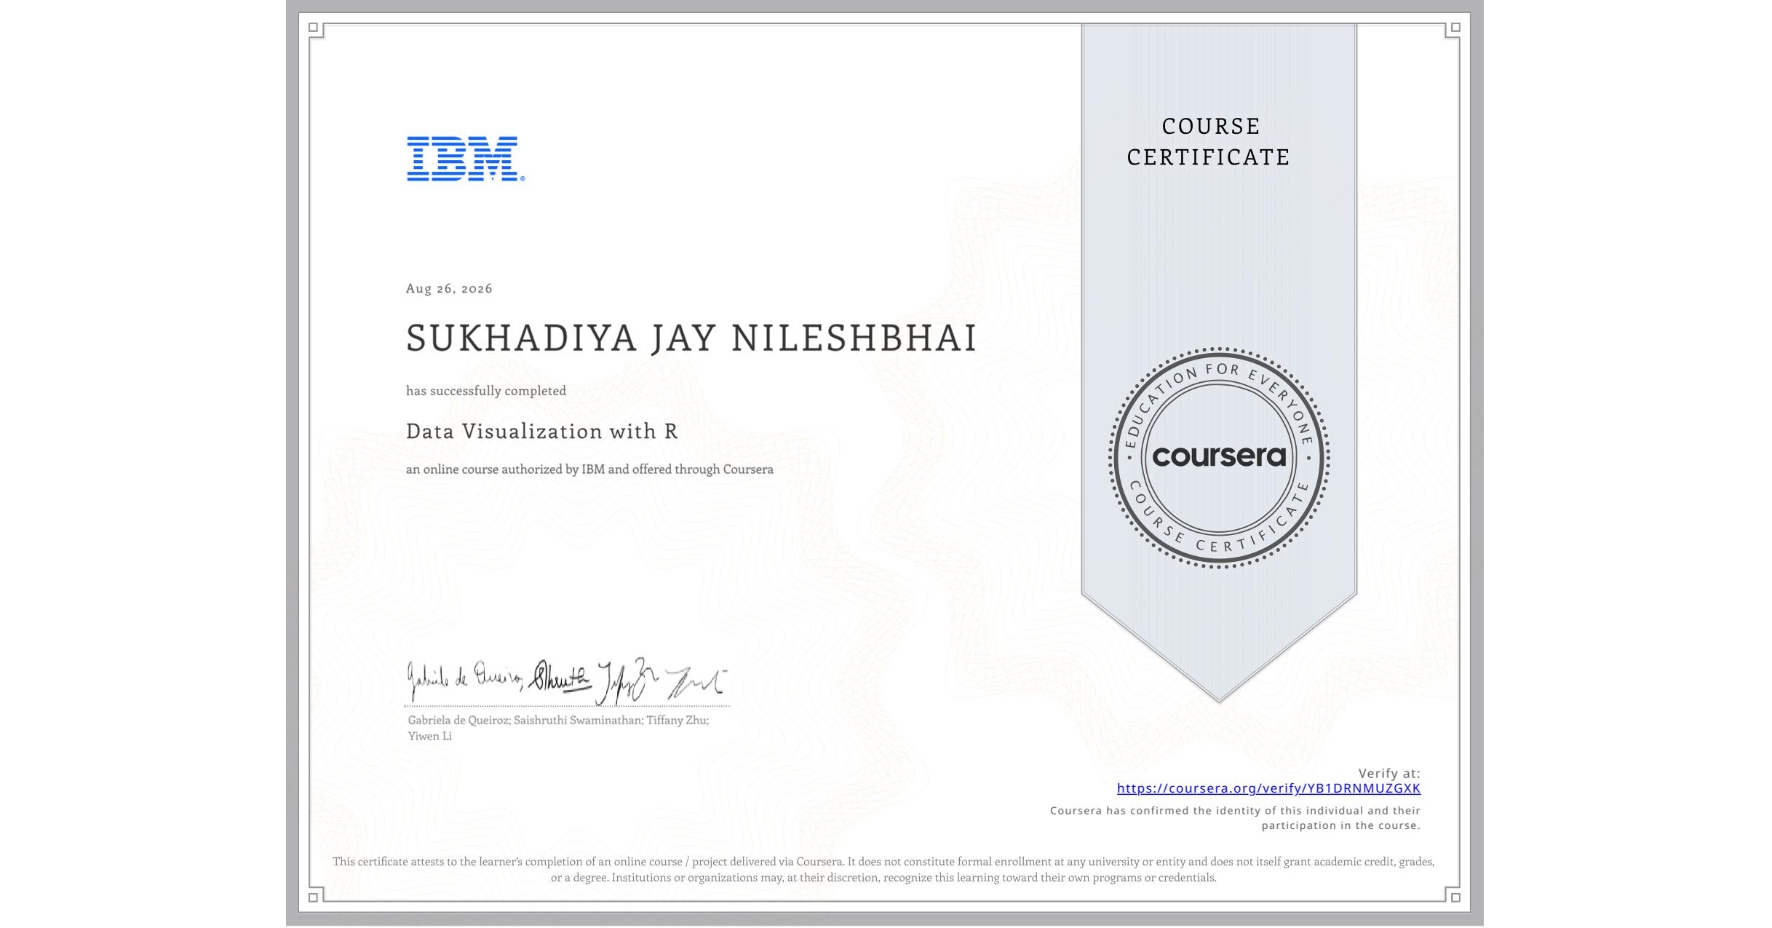
Data Visualization with R
Completed by SUKHADIYA JAY NILESHBHAI
August 26, 2026
12 hours (approximately)
SUKHADIYA JAY NILESHBHAI 's account is verified. Coursera certifies their successful completion of Data Visualization with R

What you will learn
Create bar charts, histograms, pie charts, scatter plots, line graphs, box plots, and maps using R and related packages.
Design customized charts and plots using annotations, axis titles, text labels, themes, and faceting.
Create maps using the Leaflet package for R.
Create interactive dashboards using the Shiny package for R.
Skills you will gain
- Category: Interactive Data Visualization
- Category: R (Software)
- Category: UI Components
- Category: Leaflet (Software)
- Category: Data Presentation
- Category: Rmarkdown
- Category: Histogram
- Category: Dashboard
- Category: Plot (Graphics)
- Category: Box Plots
- Category: Shiny (R Package)
- Category: Data Visualization Software