Filter by
The language used throughout the course, in both instruction and assessments.
Results for "web+reports"

EIT Digital
Skills you'll gain: Semantic Web, Web Development

Coursera Project Network
Skills you'll gain: Javascript

Coursera Project Network
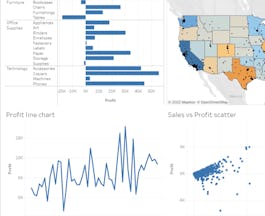
Skills you'll gain: Data Visualization, Data Visualization Software, Interactive Data Visualization, Tableau Software

University of California, Davis
Skills you'll gain: Data Analysis, Data Visualization, Tableau Software

Coursera Project Network
Skills you'll gain: Data Visualization

Skills you'll gain: SAS (Software), Statistical Programming

University of California, Davis
Skills you'll gain: Market Research, Marketing, Research and Design, Communication, Data Visualization, Market Analysis, Storytelling, Strategy, Exploratory Data Analysis, Visual Design, Data Analysis, Digital Marketing

Scrimba
Skills you'll gain: HTML and CSS

Coursera Project Network
Skills you'll gain: Web Design, Web Development
 Status: Free
Google Cloud
Skills you'll gain: Cloud Computing, Network Security

Google Cloud

Skills you'll gain: Application Development, Data Management
In summary, here are 10 of our most popular web+reports courses
- Web of Data: EIT Digital
- Validate HTML Forms with JavaScript and HTML: Coursera Project Network
- Data Visualization in Tableau: Create Dashboards and Stories: Coursera Project Network
- Data Visualization with Tableau Project: University of California, Davis
- Covid-19 Death Medical Analysis & Visualization using Plotly: Coursera Project Network
- Creating Advanced Reports with SAS Visual Analytics: SAS
- Research Report: Delivering Insights: University of California, Davis
- HTML & CSS Crash Course: Scrimba
- Draw a wireframe in Pencil Project: Coursera Project Network
- Chronicle SIEM: Outcomes & Functions: Google Cloud


