
Filter by
The language used throughout the course, in both instruction and assessments.
Results for "conversion+between+flowcharts+and+pseudocode"
Coursera Project Network
Coursera Project Network
Skills you'll gain: Data Analysis, Data Visualization
University of Colorado Boulder
Skills you'll gain: Planning, Strategy
University of California San Diego
Skills you'll gain: Problem Solving

University of Glasgow
Skills you'll gain: Computational Thinking, Javascript, Programming Principles
 Status: Free
Coursera Instructor Network
Skills you'll gain: Process Analysis
University of Colorado System
Skills you'll gain: Software Engineering, Design and Product, Software Engineering Tools, Systems Design

University of California San Diego

University of Colorado Boulder
Skills you'll gain: Planning
 Status: Free
Coursera Project Network

Coursera Project Network
Skills you'll gain: Web Design, Web Development

In summary, here are 10 of our most popular conversion+between+flowcharts+and+pseudocode courses
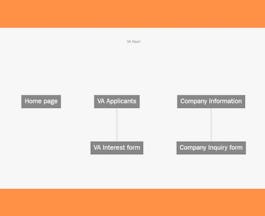
- Build a Website Map with Jumpchart: Coursera Project Network
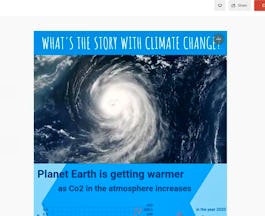
- Create an infographic with Infogram : Coursera Project Network
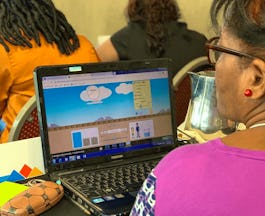
- Activity Design with PhET Simulations for STEM Education: University of Colorado Boulder
- Computational Thinking for K-12 Educators: Variables and Nested Loops: University of California San Diego
- Visual Basic Programming: Inheritance and Polymorphism: LearnQuest
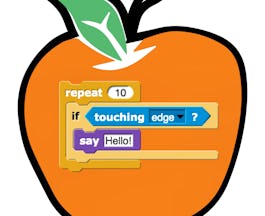
- Computational Thinking with Javascript 1: Draw & Animate: University of Glasgow
- Value Stream Mapping: Coursera Instructor Network
- SRS Documents: Requirements and Diagrammatic Notations: University of Colorado System
- Computational Thinking for K-12 Educators Capstone: University of California San Diego
- Implementación de Actividades PhET para la Educación STEM: University of Colorado Boulder


