
Filter by
The language used throughout the course, in both instruction and assessments.
Results for "table+borders"

Università di Napoli Federico II
Skills you'll gain: Business Analysis, Data Analysis, Data Management, Databases, Leadership and Management, Data Analysis Software, Decision Making, Design and Product, Microsoft Excel, Tableau Software
Skills you'll gain: Database Administration, SQL
Coursera Project Network
Skills you'll gain: Microsoft Excel, Spreadsheet Software, Data Integration, Excel Formulas, Data Import/Export, Productivity Software
 Status: Free
Coursera Project Network
Skills you'll gain: Dashboard, Interactive Data Visualization, Data Presentation, Tableau Software, Data Visualization Software, Exploratory Data Analysis, Data Analysis

Skills you'll gain: SQL
Coursera Project Network
Skills you'll gain: Data Analysis, Data Visualization, Statistical Analysis

Università di Napoli Federico II
Skills you'll gain: Design and Product, Business Analysis, Cloud Computing, Computer Architecture, Computer Networking, Data Analysis, Databases, Google Cloud Platform, Leadership and Management, Tableau Software
Coursera Project Network
Skills you'll gain: Web Development
Coursera Project Network
Skills you'll gain: Data Analysis, Data Visualization, Python Programming
 Status: Free
Coursera Instructor Network
Skills you'll gain: Data Visualization, Python Programming, Statistical Analysis

Coursera Project Network
Skills you'll gain: Leadership and Management, Marketing

In summary, here are 10 of our most popular table+borders courses
- Data Visualization e manipolazione dei dati con Tableau: Università di Napoli Federico II
- Creating a Data Warehouse Through Joins and Unions: Google Cloud
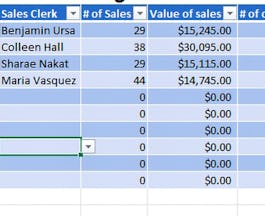
- Interweaving Tables, References, and Links in Excel: Coursera Project Network
- Dynamic Dashboards with Tableau: Advanced Sales Analysis: Coursera Project Network
- Estructuras y gestión de bases de datos con MySQL: Meta
- Creating Permanent Tables and Access-Controlled Views in BigQuery: Google Cloud
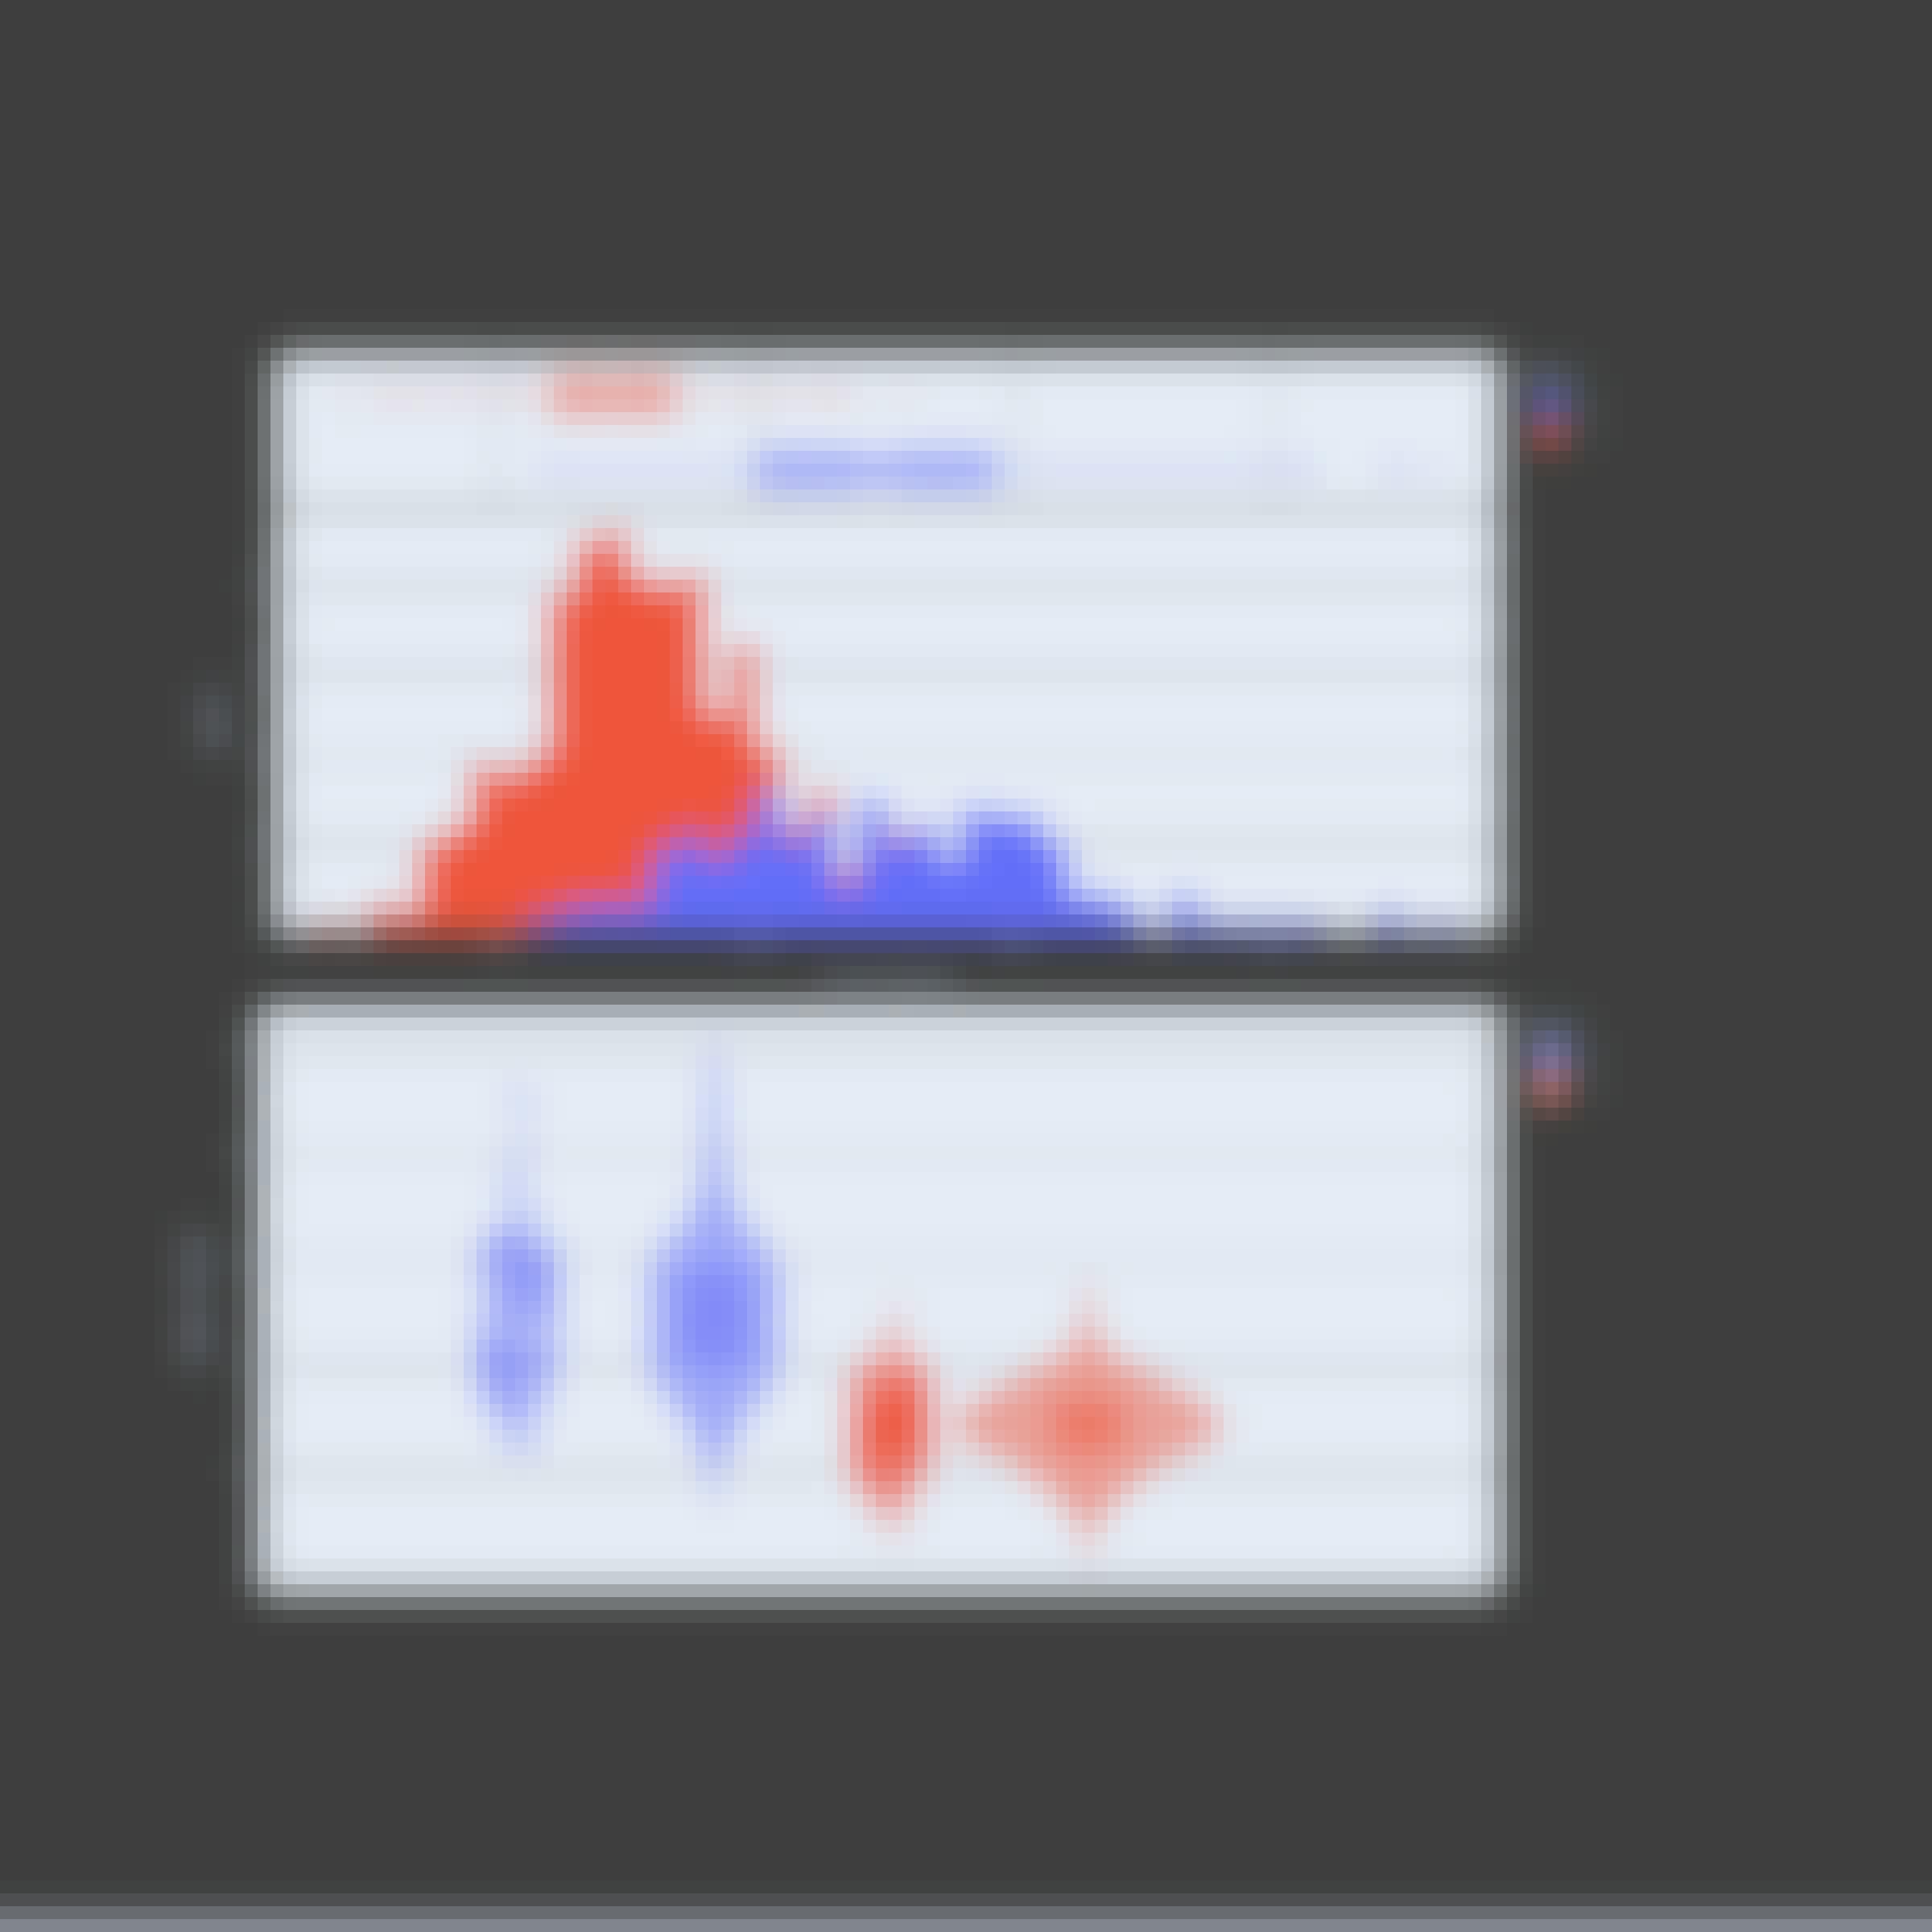
- Interactive Statistical Data Visualization 101: Coursera Project Network
- Business Intelligence con la Product Suite di Tableau: Università di Napoli Federico II
- HTML for Beginners: Tables and Forms: Coursera Project Network
- Crash Course on Interactive Data Visualization with Plotly: Coursera Project Network


