Filter by
The language used throughout the course, in both instruction and assessments.
Results for "report+and+dashboard+design"

Skills you'll gain: Data Visualization, Plot (Graphics), Microsoft Excel, Statistical Visualization, Business Analysis, Data Analysis, Data Visualization Software, Interactive Data Visualization, Spreadsheet Software
Coursera Project Network
Skills you'll gain: Data Analysis, Data Visualization, Microsoft Excel

Coursera Project Network
Skills you'll gain: Data Analysis, Microsoft Excel
 Status: Free
Skills you'll gain: Data Visualization, Extract, Transform, Load

Skills you'll gain: Data Analysis, Microsoft Excel

Skills you'll gain: Business Intelligence, Data Model, Data Visualization, Tableau Software

Skills you'll gain: Business Communication, Data Analysis, Data Visualization, Data Visualization Software, Tableau Software

Skills you'll gain: User Experience, Web Design, Web Development Tools

California Institute of the Arts
Skills you'll gain: Graphic Design, Strategy, User Experience, User Experience Design, Visual Design, Web Design
Coursera Project Network
Skills you'll gain: Marketing, Web Development

University of California, Davis
Skills you'll gain: Data Visualization, Data Analysis, Data Analysis Software, Data Visualization Software, Tableau Software, Business Analysis, Business Intelligence, Statistical Visualization, Exploratory Data Analysis, Interactive Data Visualization, Interactive Design, Software Visualization, Storytelling, Visual Design, Visualization (Computer Graphics), Plot (Graphics), Computer Graphics

Skills you'll gain: Strategy, User Experience
In summary, here are 10 of our most popular report+and+dashboard+design courses
- Data Visualization and Dashboards with Excel and Cognos: IBM
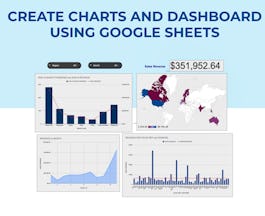
- Create Charts and Dashboard using Google Sheets: Coursera Project Network
- Create Charts and Dashboards Using Microsoft Excel: Coursera Project Network
- Data Storytelling with Power BI: Edureka
- Assessment for Data Analysis and Visualization Foundations: IBM
- Decisions, Decisions: Dashboards and Reports: Google
- Share Data Through the Art of Visualization: Google
- Build Dynamic User Interfaces (UI) for Websites: Google
- UI / UX Design: California Institute of the Arts
- Custom Reports in Google Analytics: Coursera Project Network


