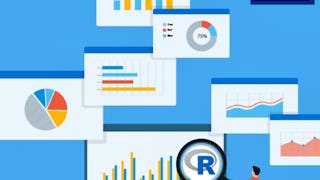
This course provides a first look at the R statistical environment. Beginning with step-by-step instructions on downloading and installing the software, learners will first practice navigating R and its companion, RStudio. Then, they will read data into the R environment and prepare it for summary and analysis. A wide variety of concepts will be covered, including sorting rows of data, grouping by variables, summarizing over variables, pivoting, and creating new variables. Then, learners will visualize their data, creating publication-ready plots with relatively little effort. Finally, learners will understand how to set up a project workflow for their own analyses. All concepts taught in this course will be covered with multiple modalities: slide-based lectures, guided coding practice with the instructor, and independent but structured practice.


Arranging and Visualizing Data in R
Ce cours fait partie de Spécialisation Data Science for Health Research

Instructeur : Philip S. Boonstra
1 945 déjà inscrits
Inclus avec 
Expérience recommandée
Expérience recommandée
Ce que vous apprendrez
Become knowledgeable about and conversant in the R environment
Format and manipulate data within R into suitable formats
Develop an intuition for doing exploratory data analysis
Develop a workflow in R
Détails à connaître

Ajouter à votre profil LinkedIn
13 devoirs
Découvrez comment les employés des entreprises prestigieuses maîtrisent des compétences recherchées

Élaborez votre expertise du sujet
- Apprenez de nouveaux concepts auprès d'experts du secteur
- Acquérez une compréhension de base d'un sujet ou d'un outil
- Développez des compétences professionnelles avec des projets pratiques
- Obtenez un certificat professionnel partageable


Obtenez un certificat professionnel
Ajoutez cette qualification à votre profil LinkedIn ou à votre CV
Partagez-le sur les réseaux sociaux et dans votre évaluation de performance

Il y a 4 modules dans ce cours
Module 1 will cover all of the tasks to get you up and running in R. You’ll learn how to access R, how to navigate it, how to install R packages, and how to create scripts that keep a record of your work. We will also learn about The Global Findex Database 2017, a population-based survey and report that provides a wealth of information on financial access for persons all over the world. Your assessments will use data from The Global Findex Database 2017 to create a table and figure from the report.
Inclus
9 vidéos8 lectures4 devoirs1 sujet de discussion
In Module 2, you will develop insight into how functions work as you are introduced to various functions from the tidyverse, which is a collection of eight R packages useful in data science. The lessons will guide you through performing common data wrangling tasks, such as filtering observations of a dataset and joining data from different sources. By the end of the module, you will have used these tools to reproduce the Indicator Table from The Global Findex Database 2017, which estimates account ownership statistics, including gender and income gaps, for all of the surveyed countries.
Inclus
15 vidéos13 lectures5 devoirs1 sujet de discussion
Module 3 introduces you to R graphical capabilities. You will both learn about different types of plots – including scatterplots, lineplots, barplots, boxplots, and histograms – and how to make them in R. You’ll learn how to create multipanel plots. And you’ll continue to learn good overall R “hygiene” by keeping your code tidy. You’ll put these newly learned skills to work re-creating Figure 1.1 from The Global Findex Database 2017, which shows how account ownership varies by the income level of a country.
Inclus
19 vidéos7 lectures4 devoirs
Having worked through the first three modules, you’ve (re)produced a table and figure from The Global Findex Database 2017. Now what? In Module 4, you will learn about sharing your work with others: exporting tables and figures from R onto your computer. You’ll be introduced to a means of writing reports in R using RMarkdown. And finally we’ll talk about what happens when you get stuck: how to ask questions and where to get help.
Inclus
5 vidéos4 lectures1 évaluation par les pairs
Instructeur

Offert par
Recommandé si vous êtes intéressé(e) par Data Analysis


Duke University


Johns Hopkins University
Pour quelles raisons les étudiants sur Coursera nous choisissent-ils pour leur carrière ?


Ouvrez de nouvelles portes avec Coursera Plus
Accès illimité à 10,000+ cours de niveau international, projets pratiques et programmes de certification prêts à l'emploi - tous inclus dans votre abonnement.

Faites progresser votre carrière avec un diplôme en ligne
Obtenez un diplôme auprès d’universités de renommée mondiale - 100 % en ligne

Rejoignez plus de 3 400 entreprises mondiales qui ont choisi Coursera pour les affaires
Améliorez les compétences de vos employés pour exceller dans l’économie numérique
Foire Aux Questions
Access to lectures and assignments depends on your type of enrollment. If you take a course in audit mode, you will be able to see most course materials for free. To access graded assignments and to earn a Certificate, you will need to purchase the Certificate experience, during or after your audit. If you don't see the audit option:
The course may not offer an audit option. You can try a Free Trial instead, or apply for Financial Aid.
The course may offer 'Full Course, No Certificate' instead. This option lets you see all course materials, submit required assessments, and get a final grade. This also means that you will not be able to purchase a Certificate experience.
When you enroll in the course, you get access to all of the courses in the Specialization, and you earn a certificate when you complete the work. Your electronic Certificate will be added to your Accomplishments page - from there, you can print your Certificate or add it to your LinkedIn profile. If you only want to read and view the course content, you can audit the course for free.
If you subscribed, you get a 7-day free trial during which you can cancel at no penalty. After that, we don’t give refunds, but you can cancel your subscription at any time. See our full refund policy.


