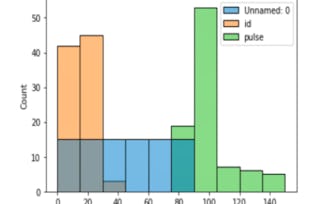
This course provides a comprehensive introduction to data analysis, focusing on the understanding and interpretation of data sets. Students will learn to describe data sets, characterize variables, create and interpret graphs, and identify and interpret frequency distributions using jamovi. The course also emphasizes the critical evaluation of data presentation, teaching students to discern the appropriate use and potential misuse of graphs.

How to Create and Explore a Data Set

How to Create and Explore a Data Set
Ce cours fait partie de Spécialisation Data Exploration in Psychology

Instructeur : Mike Stadler, PhD
Inclus avec
Expérience recommandée
Ce que vous apprendrez
Describe the elements and structure of a data set.
Give examples of the effective use of frequency distributions.
Learn operation and use of jamovi to create and navigate a data set and generate its frequency distributions,
Compétences que vous acquerrez
- Catégorie : Statistical Software
- Catégorie : Data Visualization Software
- Catégorie : Histogram
- Catégorie : Graphing
- Catégorie : Data Analysis
- Catégorie : Data Management
- Catégorie : Statistics
- Catégorie : Exploratory Data Analysis
- Catégorie : Descriptive Statistics
- Catégorie : Data Literacy
- Catégorie : Research
- Catégorie : Psychology
Détails à connaître

Ajouter à votre profil LinkedIn
13 devoirs
Découvrez comment les employés des entreprises prestigieuses maîtrisent des compétences recherchées

Élaborez votre expertise du sujet
- Apprenez de nouveaux concepts auprès d'experts du secteur
- Acquérez une compréhension de base d'un sujet ou d'un outil
- Développez des compétences professionnelles avec des projets pratiques
- Obtenez un certificat professionnel partageable

Il y a 7 modules dans ce cours
This module introduces you to your PsycLearn Essentials course. Find out what’s included in this course and how to navigate the modules and lessons. You’ll also learn valuable study tips for successful learning.
Inclus
7 lectures
This module provides a variety of information and tools from the American Psychological Association (APA) that will help inspire you as you complete your coursework and plan your career goals. Get discounted access to Academic Writer, APA’s online tool for writing effectively, as well as valuable advice that will help you develop and strengthen your skillset for learning success and future employment. Additionally, explore resources on various psychological issues. This module also includes APA resources on scholarly research and writing; a list of sites providing valuable resources on diversity, equity, and inclusion in psychology education and in the professional community; resources on a career in psychology; and links to career opportunities at the APA. You can also view videos that offer tips on dealing with stress.
Inclus
8 lectures
Once data have been collected, we must confront the question, “How do we summarize these data clearly and efficiently?” Graphs can help answer this question. We will explore the use and misuse of graphs, along with applications of the most common types of graphs.
Inclus
1 vidéo1 lecture
There is much talk around the world about big data and analytics. Imagine the amount of data that big companies have stored up by recording every interaction with a customer. What did the customer search for? What did the customer purchase? How much does a given customer spend in an average order, or over the course of a year? The data must be organized and structured in very particular ways or it would be worthless. The same is true of observations in psychological science, or any science. The observations must be collected and stored in an organized way so that they may be useful for later analysis. This module introduces basic concepts about how data sets are organized and inspected.
Inclus
4 vidéos4 lectures6 devoirs
This module explores the general nature of graphical representations of data and their usefulness, and then specifically explores the use of frequency distributions for different types of data.
Inclus
2 vidéos4 lectures3 devoirs
In this module, we explore the use of bar graphs and histograms to describe a data set. We also introduce the jamovi statistical analysis software program, which we then use to create bar graphs and histograms.
Inclus
7 vidéos2 lectures3 devoirs
Inclus
10 lectures1 devoir
Obtenez un certificat professionnel
Ajoutez ce titre à votre profil LinkedIn, à votre curriculum vitae ou à votre CV. Partagez-le sur les médias sociaux et dans votre évaluation des performances.
Instructeur

Offert par
En savoir plus sur Data Analysis
 Statut : Prévisualisation
 Statut : Essai gratuit
University of Colorado Boulder

Google Cloud
Pour quelles raisons les étudiants sur Coursera nous choisissent-ils pour leur carrière ?

Felipe M.

Jennifer J.

Larry W.

Chaitanya A.

Ouvrez de nouvelles portes avec Coursera Plus
Accès illimité à 10,000+ cours de niveau international, projets pratiques et programmes de certification prêts à l'emploi - tous inclus dans votre abonnement.
Faites progresser votre carrière avec un diplôme en ligne
Obtenez un diplôme auprès d’universités de renommée mondiale - 100 % en ligne
Rejoignez plus de 3 400 entreprises mondiales qui ont choisi Coursera pour les affaires
Améliorez les compétences de vos employés pour exceller dans l’économie numérique
Foire Aux Questions
To access the course materials, assignments and to earn a Certificate, you will need to purchase the Certificate experience when you enroll in a course. You can try a Free Trial instead, or apply for Financial Aid. The course may offer 'Full Course, No Certificate' instead. This option lets you see all course materials, submit required assessments, and get a final grade. This also means that you will not be able to purchase a Certificate experience.
When you enroll in the course, you get access to all of the courses in the Specialization, and you earn a certificate when you complete the work. Your electronic Certificate will be added to your Accomplishments page - from there, you can print your Certificate or add it to your LinkedIn profile.
Yes. In select learning programs, you can apply for financial aid or a scholarship if you can’t afford the enrollment fee. If fin aid or scholarship is available for your learning program selection, you’ll find a link to apply on the description page.
Plus de questions
Aide financière disponible,


