University of Leeds

Exploratory Data Analysis

Robert Aykroyd

Instructor: Robert Aykroyd

1,901 already enrolled

Included with Coursera Plus

Gain insight into a topic and learn the fundamentals.
Intermediate level

Recommended experience

9 hours to complete
3 weeks at 3 hours a week
Flexible schedule
Learn at your own pace
Prepare for a degree
Gain insight into a topic and learn the fundamentals.
Intermediate level

Recommended experience

9 hours to complete
3 weeks at 3 hours a week
Flexible schedule
Learn at your own pace
Prepare for a degree

What you'll learn

  • Explain the different data types and apply data preparation methods to clean data.

  • Explore ways to visualise data using the software R.

  • Understand how visualisation of data can inform statistical model selection.

Details to know

Shareable certificate

Add to your LinkedIn profile

Assessments

2 quizzes, 1 assignment

Taught in English

See how employees at top companies are mastering in-demand skills

Placeholder
Placeholder

Earn a career certificate

Add this credential to your LinkedIn profile, resume, or CV

Share it on social media and in your performance review

Placeholder

There are 3 modules in this course

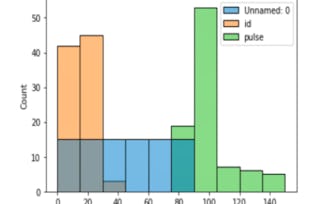
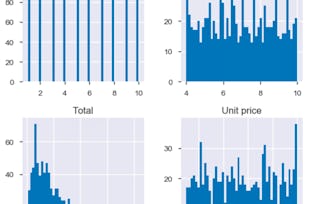
This first week introduces you to data types (categorical, discrete, and continuous) and representing data via graphical summaries (or data visualisation). You will go through the steps you need to take to prepare data for analysis and data cleaning, by identifying missing data and outliers. You learn about and practice common graphical summaries such as box plots, histograms, and kernel density estimation (KDE).

What's included

5 videos6 readings1 quiz1 assignment1 ungraded lab

This second week gives you the opportunity to apply your knowledge of graphical summaries from Week 1 in greater depth, with tasks in RStudio to complete such as preparing data for analysis and data cleaning, by identifying missing data and outliers.

What's included

2 readings1 quiz1 discussion prompt1 ungraded lab

In this final week, you have the opportunity to build on your experiences of RStudio and data analysis using graphical summaries in Week 2. In Week 3, you complete a substantive task in RStudio to complete and there is a graded peer review where you share your output from the RStudio lab with a fellow student.

What's included

2 readings1 peer review1 ungraded lab

Instructor

Robert Aykroyd
University of Leeds
1 Course1,901 learners

Offered by

Recommended if you're interested in Data Analysis

Prepare for a degree

Taking this course by University of Leeds may provide you with a preview of the topics, materials and instructors in a related degree program which can help you decide if the topic or university is right for you.

Why people choose Coursera for their career

Felipe M.
Learner since 2018
"To be able to take courses at my own pace and rhythm has been an amazing experience. I can learn whenever it fits my schedule and mood."
Jennifer J.
Learner since 2020
"I directly applied the concepts and skills I learned from my courses to an exciting new project at work."
Larry W.
Learner since 2021
"When I need courses on topics that my university doesn't offer, Coursera is one of the best places to go."
Chaitanya A.
"Learning isn't just about being better at your job: it's so much more than that. Coursera allows me to learn without limits."

New to Data Analysis? Start here.

Placeholder

Open new doors with Coursera Plus

Unlimited access to 10,000+ world-class courses, hands-on projects, and job-ready certificate programs - all included in your subscription

Advance your career with an online degree

Earn a degree from world-class universities - 100% online

Join over 3,400 global companies that choose Coursera for Business

Upskill your employees to excel in the digital economy

Frequently asked questions