
Filter by
The language used throughout the course, in both instruction and assessments.
Results for "dashboards+und+diagramme"

Skills you'll gain: Dashboard, Data Storytelling, Data Visualization Software, Microsoft Excel, Spreadsheet Software, Graphing, Pivot Tables And Charts, Data Modeling, Databases, Data Analysis, Simulation and Simulation Software
Skills you'll gain: Dashboard, Data Import/Export, Business Intelligence, Google Cloud Platform, Data Integration, Database Development, Big Data, Query Languages
 Status: Free
Coursera Project Network
Skills you'll gain: Data Analysis Expressions (DAX), Power BI, Business Analysis, Microsoft Power Platform, Financial Data, Business Intelligence, Data Modeling, Financial Analysis, Microsoft Excel, Time Series Analysis and Forecasting

University of Colorado System
Skills you'll gain: Database Design, Data Warehousing, Relational Databases, Data Visualization, Decision Support Systems, Business Intelligence, Data Modeling, Business Intelligence Software, Database Management Systems, Databases, Dashboard, Business Process Management, SQL, Star Schema, Data Governance, Data Presentation, Data Integration, Oracle Databases, Extract, Transform, Load, Data Visualization Software
Coursera Project Network
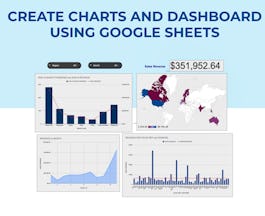
Skills you'll gain: Dashboard, Google Sheets, Spreadsheet Software, Pivot Tables And Charts, Data Visualization, Data Visualization Software, Data Presentation, Interactive Data Visualization, Excel Formulas, Data Cleansing, Data Manipulation

Johns Hopkins University
Skills you'll gain: Rmarkdown, Shiny (R Package), Ggplot2, Tidyverse (R Package), Data Visualization, Spatial Data Analysis, Scatter Plots, Plot (Graphics), Dashboard, Data Import/Export, Data Visualization Software, Interactive Data Visualization, R Programming, Geospatial Information and Technology, Statistical Reporting, Plotly, Statistical Visualization, Data Storytelling, Heat Maps, Data Manipulation

Skills you'll gain: IBM Cognos Analytics, Data Visualization, Dashboard, Business Intelligence, Interactive Data Visualization, Data Presentation, Looker (Software), Data Visualization Software, Business Intelligence Software, Data Analysis, Analytics

Corporate Finance Institute
Skills you'll gain: Data Analysis Expressions (DAX), Power BI, Data Modeling, Business Intelligence, Microsoft Excel, Pivot Tables And Charts, Spreadsheet Software, Data Analysis Software, Data Manipulation, Time Series Analysis and Forecasting
Coursera Project Network

Skills you'll gain: Data Visualization Software, Tableau Software, Dashboard, Forecasting, Interactive Data Visualization, Data Storytelling, Geospatial Information and Technology, Data Mapping, Time Series Analysis and Forecasting, Data Analysis

Skills you'll gain: User Centered Design, Responsive Web Design, Web Design and Development, Prototyping, Front-End Web Development, User Interface and User Experience (UI/UX) Design, Figma (Design Software), Design Elements And Principles, Wireframing, Typography, UI Components, Web Applications, Mobile Development
Coursera Project Network
Skills you'll gain: Javascript
In summary, here are 10 of our most popular dashboards+und+diagramme courses
- Data Visualization with Advanced Excel: PwC
- How to Build a BI Dashboard Using Google Data Studio and BigQuery: Google Cloud
- Data Modeling with Power BI: Advanced DAX Calculations : Coursera Project Network
- Data Warehousing for Business Intelligence: University of Colorado System
- Create Charts and Dashboard using Google Sheets: Coursera Project Network
- Data Visualization & Dashboarding with R: Johns Hopkins University
- BI Dashboards with IBM Cognos Analytics and Google Looker: IBM
- Intermediate DAX & Time Intelligence: Corporate Finance Institute
- Create IT Diagrams with Lucidchart: Coursera Project Network
- Tableau for Data Visualization and Analysis: LearnKartS


